APC 2009 Annual Report Download - page 75
Download and view the complete annual report
Please find page 75 of the 2009 APC annual report below. You can navigate through the pages in the report by either clicking on the pages listed below, or by using the keyword search tool below to find specific information within the annual report.-
 1
1 -
2
-
3
-
4
-
5
-
6
-
7
-
8
-
9
-
10
-
11
-
12
-
13
-
14
-
15
-
16
-
17
-
18
-
19
-
20
-
21
-
22
-
23
-
24
-
25
-
26
-
27
-
28
-
29
-
30
-
31
-
32
-
33
-
34
-
35
-
36
-
37
-
38
-
39
-
40
-
41
-
42
-
43
-
44
-
45
-
46
-
47
-
48
-
49
-
50
-
51
-
52
-
53
-
54
-
55
-
56
-
57
-
58
-
59
-
60
-
61
-
62
-
63
-
64
-
 65
65 -
 66
66 -
 67
67 -
 68
68 -
 69
69 -
 70
70 -
 71
71 -
 72
72 -
 73
73 -
 74
74 -
 75
75 -
 76
76 -
 77
77 -
 78
78 -
 79
79 -
 80
80 -
 81
81 -
 82
82 -
 83
83 -
 84
84 -
 85
85 -
86
-
87
-
88
-
89
-
90
-
91
-
92
-
93
-
94
-
95
-
96
-
97
-
98
-
99
-
100
-
101
-
102
-
103
-
104
-
105
-
106
-
107
-
108
-
109
-
110
-
111
-
112
-
113
-
114
-
115
-
116
-
117
-
118
-
119
-
120
-
121
-
122
-
123
-
124
-
125
-
126
-
127
-
128
-
129
-
130
-
131
-
132
-
133
-
134
-
135
-
136
-
137
-
138
-
139
-
140
-
141
-
142
-
143
-
144
-
145
-
146
-
147
-
148
-
149
-
150
-
151
-
152
-
153
-
154
-
155
-
156
-
157
-
158
-
159
-
160
-
161
-
162
-
163
-
164
-
165
-
166
-
167
-
168
-
169
-
170
-
171
-
172
-
173
-
174
-
175
-
176
-
177
-
178
-
179
-
180
-
181
-
182
-
183
-
184
-
185
-
186
-
187
-
188
-
189
-
190
-
191
-
192
-
193
-
194
-
195
-
196
-
197
-
198
-
199
-
200
-
201
-
202
-
203
-
204
-
205
-
206
-
207
-
208
-
209
-
210
-
211
-
212
-
213
-
214
-
215
-
216
-
217
-
218
-
219
-
220
-
221
-
222
-
223
-
224
-
225
-
226
-
227
-
228
-
229
-
230
-
231
-
232
-
233
-
234
-
235
-
236
-
237
-
238
-
239
-
240
-
241
-
242
-
243
-
244
 |
 |

SUSTAINABLE DEVELOPMENT
2
STATUTORY AUDITORS’ REPORT ONCERTAIN ENVIRONMENTAL, SAFETY ANDHUMAN RESOURCES INDICATORS
>
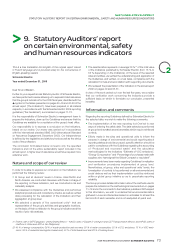
9. Statutory Auditors’ report
oncertain environmental, safety
andhuman resources indicators
This is a free translation into English of the original report issued
in French language and is provided solely for the convenience of
English-speaking readers
Schneider Electric
Year ended December 31, 2009
Dear Sir and Madam,
Further to your request and as Statutory Auditor of Schneider Electric,
we have performed a review allowing us to express limited assurance
that the group’s Indicators for the 2009 fi scal year, identifi ed with the
▲ symbol in the tables presented on pages 45-49 and 43-66 of the
annual report (“the Indicators” ), have been prepared, in all material
respects, in accordance with the Schneider Electric 2009 reporting
guidelines (“the Guidelines”), summarized on pages 71-72.
It is the responsibility of Schneider Electric’s management team to
prepare the Indicators, draw up the Guidelines and ensure that the
Guidelines are available for consultation at the group’ s head offi ce.
Our responsibility is to express a conclusion on the Indicators,
based on our review. Our review was carried out in accordance
with the international standard ISAE 3000 (International Standard
on Assurance Engagement, December 2003). Our independence
is defi ned by the legislative and statutory texts as well as the ethics
code of the profession.
The conclusion formulated below concerns only the specified
Indicators and not the entire sustainability report included in the
annual report. A higher level of assurance would have required more
extensive work.
Nature and scope of our review
In order to be able to express our conclusion on the Indicators, we
performed the following review:
•At Group and at divisions’ levels in France, Asia-Pacific and
North America, we conducted interviews with those in charge of
the reporting on these Indicators, and we conducted a risk and
materiality analysis.
•We assessed compliance with the Guidelines and performed
analytical procedures and consistency checks, as well as verifi ed
data processing for the calculation of the Indicators and their
aggregation at group level.
•We selected a sample of five operational units(1) that are
representative of the group’s activities and geographic locations,
on the basis of their contribution to the group’ s Indicators and the
results of prior risk analyses.
•The selected sites represent on average 39 % (2) of the total value
of the Indicators published by Schneider Electric (from 15 % to
55 % depending on the Indicators). At the level of the selected
sites and entities, we verifi ed the understanding and application of
the Guidelines, and verifi ed, on a test basis, compliance with the
calculation formula and reconciliation with supporting documents.
•We reviewed the presentation of the Indicators in the annual report
2009 on pages 49 and 53-61.
In view of the work carried out over the last fi ve years, we consider
that our verification work concerning the Indicators provide a
suffi cient basis on which to formulate our conclusion, presented
hereafter.
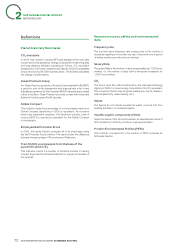
Information and comments
Regarding the reporting Guidelines defi ned by Schneider Electric for
the selected data, we wish to make the following comments:
•The implementation of the new reporting tool One led to new
ways of entering the safety data. The data extractions performed
at group level revealed several anomalies which require reinforced
controls.
•Efforts made in the sites and operational units to inform the
persons in charge of environmental and social reporting about
reporting stakes should be pursued; specifi c attention should be
paid to compliance with the Guidelines regarding the accounting
of “Produced and recovered waste” and the calculation
methodologies for the Indicators “Estimate of VOC emissions”,
“Energy Consumption” and “Percentage of purchases made with
suppliers who have signed the Global Compact or equivalent”.
•Improvements have been made regarding Guidelines formalization
and verification procedures implemented at group level.
Nevertheless, at group, sites and operational units’ levels, the
formalization of controls to be performed on all environmental and
social data as well as their implementation could be reinforced
within a global group initiative so as to perpetuate reporting
reliability.
The Group provides detailed information about the methods used to
prepare the Indicators in the methodological memorandum on pages
71–72 and in the comments to the Indicators published. With respect
to this information, we wish to underline that environmental data is
gathered in June and December based on estimates for at least the
last month of each semester and is not readjusted at year’s end.
(1) France (site of SEF Espagnac); United States/Mexico – NAOD (sites of Square D-Lexington and CST Transportation Mexico) and APOD (sites of
HuiZhou in China and APC in the Philippines).
(2) 40 % of energy consumption; 36 % of waste production and recovery; 50 % of water consumption; 55 % of CO
2
emissions; 15 % of VOC emis-
sions; 35 % of industrial and logistics headcount; 50 % of total headcount and 33 % of training hours.
2009 REGISTRATION DOCUMENT SCHNEIDER ELECTRIC 73