APC 2009 Annual Report Download - page 51
Download and view the complete annual report
Please find page 51 of the 2009 APC annual report below. You can navigate through the pages in the report by either clicking on the pages listed below, or by using the keyword search tool below to find specific information within the annual report.-
 1
1 -
2
-
3
-
4
-
5
-
6
-
7
-
8
-
9
-
10
-
11
-
12
-
13
-
14
-
15
-
16
-
17
-
18
-
19
-
20
-
21
-
22
-
23
-
24
-
25
-
26
-
27
-
28
-
29
-
30
-
31
-
32
-
33
-
34
-
35
-
36
-
37
-
38
-
39
-
40
-
 41
41 -
 42
42 -
 43
43 -
 44
44 -
 45
45 -
 46
46 -
 47
47 -
 48
48 -
 49
49 -
 50
50 -
 51
51 -
 52
52 -
 53
53 -
 54
54 -
 55
55 -
 56
56 -
 57
57 -
 58
58 -
 59
59 -
 60
60 -
 61
61 -
62
-
63
-
64
-
65
-
66
-
67
-
68
-
69
-
70
-
71
-
72
-
73
-
74
-
75
-
76
-
77
-
78
-
79
-
80
-
81
-
82
-
83
-
84
-
85
-
86
-
87
-
88
-
89
-
90
-
91
-
92
-
93
-
94
-
95
-
96
-
97
-
98
-
99
-
100
-
101
-
102
-
103
-
104
-
105
-
106
-
107
-
108
-
109
-
110
-
111
-
112
-
113
-
114
-
115
-
116
-
117
-
118
-
119
-
120
-
121
-
122
-
123
-
124
-
125
-
126
-
127
-
128
-
129
-
130
-
131
-
132
-
133
-
134
-
135
-
136
-
137
-
138
-
139
-
140
-
141
-
142
-
143
-
144
-
145
-
146
-
147
-
148
-
149
-
150
-
151
-
152
-
153
-
154
-
155
-
156
-
157
-
158
-
159
-
160
-
161
-
162
-
163
-
164
-
165
-
166
-
167
-
168
-
169
-
170
-
171
-
172
-
173
-
174
-
175
-
176
-
177
-
178
-
179
-
180
-
181
-
182
-
183
-
184
-
185
-
186
-
187
-
188
-
189
-
190
-
191
-
192
-
193
-
194
-
195
-
196
-
197
-
198
-
199
-
200
-
201
-
202
-
203
-
204
-
205
-
206
-
207
-
208
-
209
-
210
-
211
-
212
-
213
-
214
-
215
-
216
-
217
-
218
-
219
-
220
-
221
-
222
-
223
-
224
-
225
-
226
-
227
-
228
-
229
-
230
-
231
-
232
-
233
-
234
-
235
-
236
-
237
-
238
-
239
-
240
-
241
-
242
-
243
-
244
 |
 |

2009 REGISTRATION DOCUMENT SCHNEIDER ELECTRIC 49
SUSTAINABLE DEVELOPMENT
2
ENVIRONMENTAL PERFORMANCE
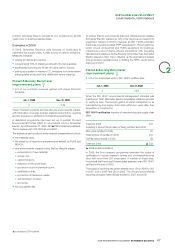
The environmental impact of our plants and distribution centres
Indicators
The indicators for commercial/service and manufacturing operations include:
Reported scope Like-for-like
2009 2008 2007 2009 2008
Number of responding sites 240 ▲234 201 232 232
Number of employees 78,078 ▲80,846 65,931 72,677 84,198
Amount of waste produced (in metric tons) 101,535 ▲144,888 119,239 98,696 143,315
Waste produced per employee (in metric tons) 1.3 ▲1.8 1.8 1.4 1.7
Recovered waste (in metric tons) 80,255 ▲113,182 95,663 78,485 111,352
Percentage of waste recovered 79% ▲78.1% 80.2% 80% 78%
Energy consumption (MWh equivalent) 1,066,173 ▲1,124,638 968,491 1,030,991 1,145,224
Energy consumption per employee (MWh) 13.7 ▲13.9 14.7 14.2 13.6
Water consumption (in cubic meters) 2,493,351 ▲2,374,035 2,123,415 2,319,057 2,691,378
Water consumption per employee (in cubic meters) 31.0 9 ▲29.4 32.2 31.9 32.0
Estimates
• CO2 emissions (in metric tons) 357,513 ▲388,125 321,823 342,320 382,753
• CO2 emissions per employee (in metric tons) 4.6 ▲4.8 4.9 4.7 4.5
• VOC emissions (in kilograms) 409,219 ▲479,172 413,731 362,636 474,125
• VOC emissions per employee (in kilograms) 5.2 ▲5.9 6.3 5.0 5.6
▲ 2009 audited indicators
.
Changes in reporting perimeter in 2009
In 2009, the reporting scope (240 sites) has been extended to certain
non-industrial entities (centres of R&D, administrative and commercial
entities) because of their size (over 300). In the framework of the
company programme One, these entities are also now subject to
the ISO 14001 certifi cation. Thus, the area in 2009 includes these
non-industrial.
To make the comparison on a like to like basis, 2008/2009, the 2008
data for non-industrial entities (7 out of 232) were taken into account.
Comments on the evolution
On a like to like basis, all indicators impacting the environment
show a decrease (energy, water, waste generation, emissions of
VOCs). This trend is closely linked to a decrease in activity due to
the economic crisis in 2009.
At constant perimeter, additional trends can be highlighted:
•energy consumption down 10% but consumption per person
increase;
•water consumption reduction, but by the actual ratio remains
relatively stable. Indeed, indicators calculated per person lose
relevance in the context of the crisis, some are related to activity
level and others not;
•the ratio of recycled waste on waste generated increases by
2points and irrespective of the fl uctuation of the activity.
Consumption of water, energy
and raw materials
Water and energy consumption
The Group provides a detailed breakdown of water consumption that
takes into account groundwater and water from the public network.
Water used solely for cooling and then immediately released without
any change is also included in the statistics.
Energy consumption includes electricity, heating fuel, natural gas
and, in rare cases, heat from urban hot water networks.
Water and energy consumption are consolidated in the above table
of indicators.
Raw materials consumption
Schneider Electric focuses on making its devices more compact
to conserve natural resources and on improving its lineup to make
electrical installations more energy effi cient so that customers have
more environmentally friendly products to choose from.
The Group has developed design tools for managing thermal and
electrical constraints so that it can optimise the amount of materials
required in production.
Each device’s Product Environmental Profi le lists the materials used.
To facilitate end-of-life processing, Schneider Electric chooses
materials that are easy to recycle and clip-together systems that
are easy to disassemble. Life cycle analyses and recyclability
assessments also help the Group identify areas for improvement.