APC 2009 Annual Report Download - page 221
Download and view the complete annual report
Please find page 221 of the 2009 APC annual report below. You can navigate through the pages in the report by either clicking on the pages listed below, or by using the keyword search tool below to find specific information within the annual report.-
 1
1 -
2
-
3
-
4
-
5
-
6
-
7
-
8
-
9
-
10
-
11
-
12
-
13
-
14
-
15
-
16
-
17
-
18
-
19
-
20
-
21
-
22
-
23
-
24
-
25
-
26
-
27
-
28
-
29
-
30
-
31
-
32
-
33
-
34
-
35
-
36
-
37
-
38
-
39
-
40
-
41
-
42
-
43
-
44
-
45
-
46
-
47
-
48
-
49
-
50
-
51
-
52
-
53
-
54
-
55
-
56
-
57
-
58
-
59
-
60
-
61
-
62
-
63
-
64
-
65
-
66
-
67
-
68
-
69
-
70
-
71
-
72
-
73
-
74
-
75
-
76
-
77
-
78
-
79
-
80
-
81
-
82
-
83
-
84
-
85
-
86
-
87
-
88
-
89
-
90
-
91
-
92
-
93
-
94
-
95
-
96
-
97
-
98
-
99
-
100
-
101
-
102
-
103
-
104
-
105
-
106
-
107
-
108
-
109
-
110
-
111
-
112
-
113
-
114
-
115
-
116
-
117
-
118
-
119
-
120
-
121
-
122
-
123
-
124
-
125
-
126
-
127
-
128
-
129
-
130
-
131
-
132
-
133
-
134
-
135
-
136
-
137
-
138
-
139
-
140
-
141
-
142
-
143
-
144
-
145
-
146
-
147
-
148
-
149
-
150
-
151
-
152
-
153
-
154
-
155
-
156
-
157
-
158
-
159
-
160
-
161
-
162
-
163
-
164
-
165
-
166
-
167
-
168
-
169
-
170
-
171
-
172
-
173
-
174
-
175
-
176
-
177
-
178
-
179
-
180
-
181
-
182
-
183
-
184
-
185
-
186
-
187
-
188
-
189
-
190
-
191
-
192
-
193
-
194
-
195
-
196
-
197
-
198
-
199
-
200
-
201
-
202
-
203
-
204
-
205
-
206
-
207
-
208
-
209
-
210
-
 211
211 -
 212
212 -
 213
213 -
 214
214 -
 215
215 -
 216
216 -
 217
217 -
 218
218 -
 219
219 -
 220
220 -
 221
221 -
 222
222 -
 223
223 -
 224
224 -
 225
225 -
 226
226 -
 227
227 -
 228
228 -
 229
229 -
 230
230 -
 231
231 -
232
-
233
-
234
-
235
-
236
-
237
-
238
-
239
-
240
-
241
-
242
-
243
-
244
 |
 |
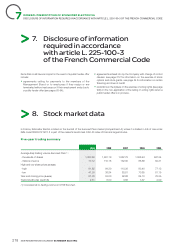
2009 REGISTRATION DOCUMENT SCHNEIDER ELECTRIC 219
GENERAL PRESENTATION OF SCHNEIDER ELECTRIC SA
7
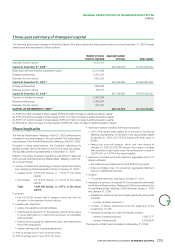
STOCK MARKET DATA
18-month trading data
Year Month Trading volume
(in thousands of shares)(2)
Value
(in millions of euros)
Price (in euros)(3)
High Low
2008 August 26,284 1,830 73.83 66.00
September 38,745 2,500 72.35 56.26
October 56,574 2,740 62.00 38.84
November 32,193 1,530 52.30 41.16
December 26,733 1,380 55.44 44.30
2009 January 40,744 1,976 58.00 41.30
February 33,057 1,709 55.89 46.92
March 35,275 1,697 53.13 43.00
April 32,936 1,766 58.59 48.73
May 30,346 1,642 56.07 51.00
June 28,425 1,522 56.98 51.10
July 26,740 1,528 64.55 51.30
August 20,722 1,335 67.96 61.45
September 26,642 1,844 74.05 61.98
October 26,709 1,921 77.40 65.93
November 19,586 1,455 76.97 69.61
December 17,652 1,348 81.85 74.08
TOTAL 2009 338,836 19,743
2010 January 19,965 1,569 82.74 73.75
(2) Corresponds to trading volume on NYSE Euronext.
(3) During the trading session.
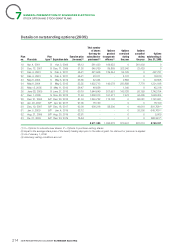
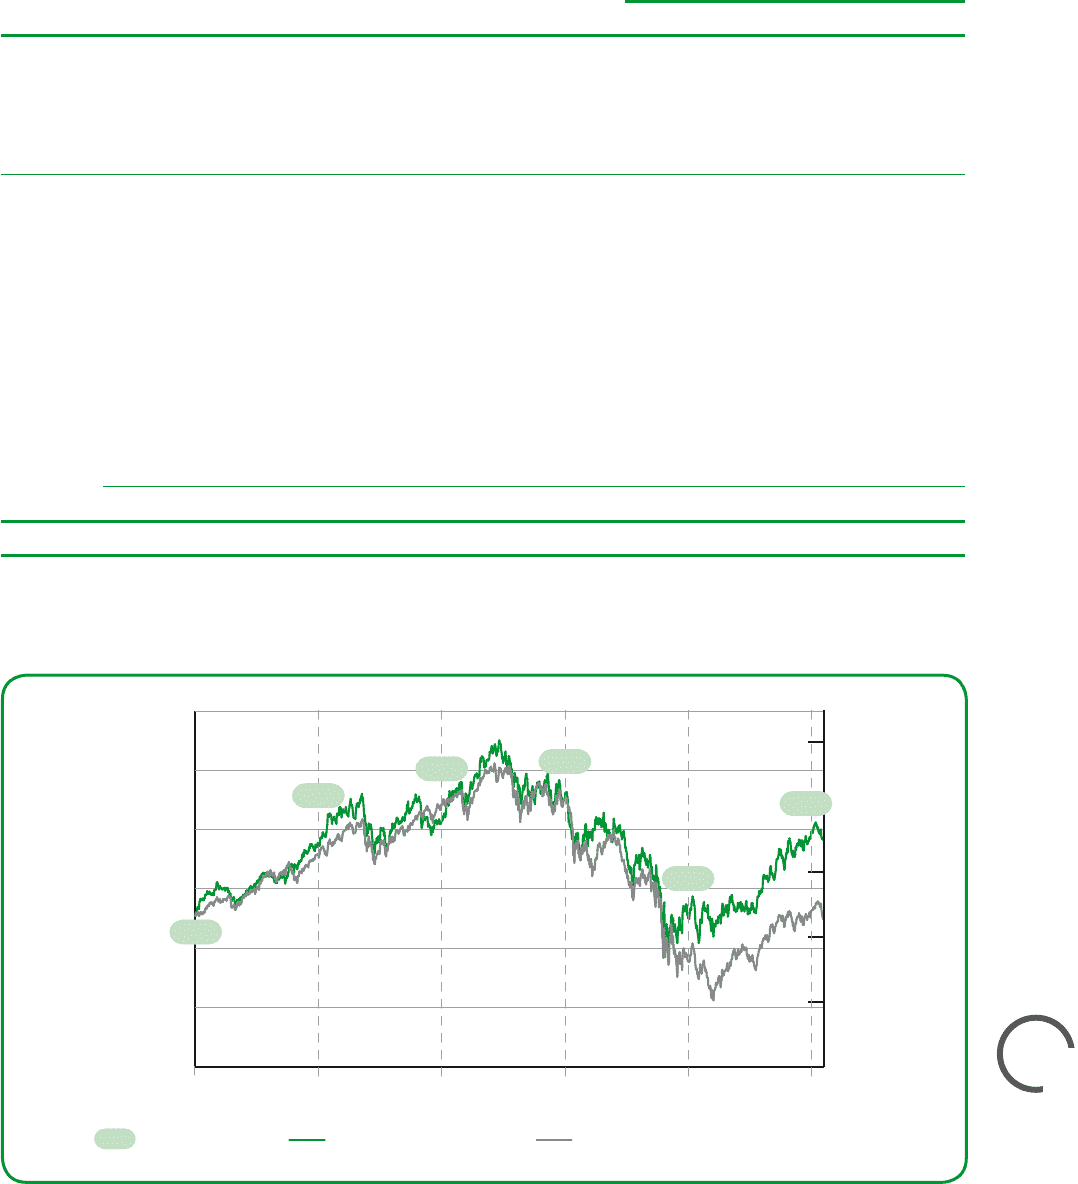
The Schneider Electric SA share versus the CAC 40 index over 5 years
0
20
40
60
80
100
120
1,500
2,500
3,500
4,500
5,500
6,500
51.20
75.35
84.10 92.68
53.00
81.78
Share value in euros Schneider Electric share CAC 40 Index (base : Schneider Electric
on December 31, 2004)
dec. 31, 2009dec. 31, 2007dec. 31, 2006dec. 31, 2005dec. 31, 2004 dec. 31, 2008
Schneider Electric
share CAC 40 Index
(Source Reuters)