APC 2009 Annual Report Download - page 109
Download and view the complete annual report
Please find page 109 of the 2009 APC annual report below. You can navigate through the pages in the report by either clicking on the pages listed below, or by using the keyword search tool below to find specific information within the annual report.-
 1
1 -
2
-
3
-
4
-
5
-
6
-
7
-
8
-
9
-
10
-
11
-
12
-
13
-
14
-
15
-
16
-
17
-
18
-
19
-
20
-
21
-
22
-
23
-
24
-
25
-
26
-
27
-
28
-
29
-
30
-
31
-
32
-
33
-
34
-
35
-
36
-
37
-
38
-
39
-
40
-
41
-
42
-
43
-
44
-
45
-
46
-
47
-
48
-
49
-
50
-
51
-
52
-
53
-
54
-
55
-
56
-
57
-
58
-
59
-
60
-
61
-
62
-
63
-
64
-
65
-
66
-
67
-
68
-
69
-
70
-
71
-
72
-
73
-
74
-
75
-
76
-
77
-
78
-
79
-
80
-
81
-
82
-
83
-
84
-
85
-
86
-
87
-
88
-
89
-
90
-
91
-
92
-
93
-
94
-
95
-
96
-
97
-
98
-
 99
99 -
 100
100 -
 101
101 -
 102
102 -
 103
103 -
 104
104 -
 105
105 -
 106
106 -
 107
107 -
 108
108 -
 109
109 -
 110
110 -
 111
111 -
 112
112 -
 113
113 -
 114
114 -
 115
115 -
 116
116 -
 117
117 -
 118
118 -
 119
119 -
120
-
121
-
122
-
123
-
124
-
125
-
126
-
127
-
128
-
129
-
130
-
131
-
132
-
133
-
134
-
135
-
136
-
137
-
138
-
139
-
140
-
141
-
142
-
143
-
144
-
145
-
146
-
147
-
148
-
149
-
150
-
151
-
152
-
153
-
154
-
155
-
156
-
157
-
158
-
159
-
160
-
161
-
162
-
163
-
164
-
165
-
166
-
167
-
168
-
169
-
170
-
171
-
172
-
173
-
174
-
175
-
176
-
177
-
178
-
179
-
180
-
181
-
182
-
183
-
184
-
185
-
186
-
187
-
188
-
189
-
190
-
191
-
192
-
193
-
194
-
195
-
196
-
197
-
198
-
199
-
200
-
201
-
202
-
203
-
204
-
205
-
206
-
207
-
208
-
209
-
210
-
211
-
212
-
213
-
214
-
215
-
216
-
217
-
218
-
219
-
220
-
221
-
222
-
223
-
224
-
225
-
226
-
227
-
228
-
229
-
230
-
231
-
232
-
233
-
234
-
235
-
236
-
237
-
238
-
239
-
240
-
241
-
242
-
243
-
244
 |
 |

2009 REGISTRATION DOCUMENT SCHNEIDER ELECTRIC 107
BUSINESS REVIEW
4
REVIEW OF THE CONSOLIDATED FINANCIAL STATEMENTS
>
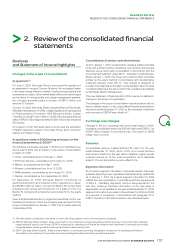
2. Review of the consolidated financial
statements
Business
and Statement of Income highlights
Changes in the scope of consolidation
Acquisitions (1)
On June 4, 2009, Schneider Electric announced the signature of
an agreement to acquire Conzerv Systems, the recognised leader
in the Indian energy effi ciency market, notably among industrial and
commercial end users. As the market leader with proven technologies
and solutions for energy audits and energy management systems,
the company generates sales in excess of EUR 10million and
employs 337 people.
On June 19, 2009, Schneider Electric acquired Microsol Tecnologia,
a Brazilian manufacturer of UPSs, voltage regulators and accessories
for Power protection. Founded in 1982, Microsol is the No.3 player
in the fi eld of critical Power in Brazil. In 2008, Microsol generated net
sales of BRL65million (approximately EUR 24million) and employed
500 people.
On August 6, 2009, Schneider Electric announced the acquisition
of Meher Capacitors, leader in the Indian Power factor correction
market, from Meher Group.
Acquisitions made in 2008 having an impact on the
financial statements of 2009 (1)
The following companies acquired in 2008 and consolidated over
the full year in 2009 had an impact on the scope of consolidation
in relation to 2008:
•Arrow, consolidated as from February 1, 2008;
•ECP Tech Services, consolidated as from April 13, 2008;
•Marisio, consolidated as from May 7, 2008;
•Wessen, consolidated as from June 15, 2008;
•RAM Industries, consolidated as from August 12, 2008;
•Xantrex, consolidated as from September 29, 2008.
On September 30, 2008, Schneider Electric contributed its
electrical distribution and industrial control operations in Japan
and EUR 60million in cash to its new Fuji Electric FA Components
& Systems joint venture with Fuji Electric, for a stake of 37%. Fuji
Electric FA Components & Systems is accounted for by the equity
method.
Given that Schneider Electric no longer had operational control over
the East joint venture in China, the company was removed from the
scope of consolidation on January 1, 2009. The company was sold
in December 2009.
Consolidation of jointly controlled entities
As from January 1, 2009, investments in operating entities controlled
jointly with a limited number of partners, such as joint ventures and
alliances, are proportionally consolidated in accordance with the
recommended treatment under IAS31 - Interests in Joint Ventures.
Before January 1, 2009, the Group accounted for jointly controlled
entities by the equity method in accordance with the alternative
treatment allowed under IAS31. This change is designed to
provide more meaningful information on the strategic nature of jointly
controlled entities and the way in which their operations are tracked
by Schneider Electric management.
This new treatment of Delixi Electric’s 2009 revenue is refl ected in
changes in the scope of consolidation.
The changes in the scope of consolidation described above did not
have a material impact on the consolidated fi nancial statements for
the period ended December 31, 2009, as the net impact of additions
and removals on EBITAR was virtually nil
(2)
.
Exchange rate changes
Changes in the euro exchange rate had a small impact in 2009,
increasing consolidated revenue by EUR 144million and EBITA(3) by
EUR 47million (impact of conversions only). The impact on EBITA
margin was 0.2 points.
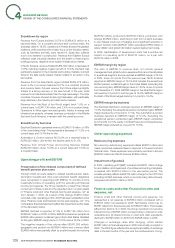
Revenue
Consolidated revenue totalled EUR 15,793million for the year
ended December 31, 2009, down 13.8% on a current structure
and currency basis from the year before. Negative organic growth
reduced revenue by 15.7%, while acquisitions net of disposals
added 1.3% and the positive currency effect 0.6%.
Segment information
As concerns segment information, Schneider Electric has been
gradually deploying a new organisation that became fully operational
as of January 1, 2010. As a result, segment information for 2009
refl ects this new organisation , in accordance with the requirements
of IFRS8 - Operating Segments, which is being applied for the
first time. However, because information on the new basis of
segmentation is not available for the year ended December 31, 2008,
segment information is provided on the old basis for 2009 and 2008
for purposes of comparison, in accordance with paragraph30 of
IFRS8. Trends from this last comparison are described below.
(1) The dates given correspond to the dates on which the Group gained control of the acquired companies.
(2) EBITAR (Earnings Before Interest, Taxes, amortisation of purchase accounting intangibles and Restructuring Costs) is the main operating
margin indicator used by the Group. EBITAR corresponds to operating profi t before amortisation and impairment of purchase accounting
intangible assets, before goodwill impairment and before restructuring costs.
(3) EBIT
A
(Earnings Before Interest, Taxes and amortisation of purchase accounting intangibles) corresponds to operating profi t before
amortisation and impairment of purchase accounting intangible assets and before goodwill impairment.