APC 2009 Annual Report Download - page 108
Download and view the complete annual report
Please find page 108 of the 2009 APC annual report below. You can navigate through the pages in the report by either clicking on the pages listed below, or by using the keyword search tool below to find specific information within the annual report.-
 1
1 -
2
-
3
-
4
-
5
-
6
-
7
-
8
-
9
-
10
-
11
-
12
-
13
-
14
-
15
-
16
-
17
-
18
-
19
-
20
-
21
-
22
-
23
-
24
-
25
-
26
-
27
-
28
-
29
-
30
-
31
-
32
-
33
-
34
-
35
-
36
-
37
-
38
-
39
-
40
-
41
-
42
-
43
-
44
-
45
-
46
-
47
-
48
-
49
-
50
-
51
-
52
-
53
-
54
-
55
-
56
-
57
-
58
-
59
-
60
-
61
-
62
-
63
-
64
-
65
-
66
-
67
-
68
-
69
-
70
-
71
-
72
-
73
-
74
-
75
-
76
-
77
-
78
-
79
-
80
-
81
-
82
-
83
-
84
-
85
-
86
-
87
-
88
-
89
-
90
-
91
-
92
-
93
-
94
-
95
-
96
-
97
-
 98
98 -
 99
99 -
 100
100 -
 101
101 -
 102
102 -
 103
103 -
 104
104 -
 105
105 -
 106
106 -
 107
107 -
 108
108 -
 109
109 -
 110
110 -
 111
111 -
 112
112 -
 113
113 -
 114
114 -
 115
115 -
 116
116 -
 117
117 -
 118
118 -
119
-
120
-
121
-
122
-
123
-
124
-
125
-
126
-
127
-
128
-
129
-
130
-
131
-
132
-
133
-
134
-
135
-
136
-
137
-
138
-
139
-
140
-
141
-
142
-
143
-
144
-
145
-
146
-
147
-
148
-
149
-
150
-
151
-
152
-
153
-
154
-
155
-
156
-
157
-
158
-
159
-
160
-
161
-
162
-
163
-
164
-
165
-
166
-
167
-
168
-
169
-
170
-
171
-
172
-
173
-
174
-
175
-
176
-
177
-
178
-
179
-
180
-
181
-
182
-
183
-
184
-
185
-
186
-
187
-
188
-
189
-
190
-
191
-
192
-
193
-
194
-
195
-
196
-
197
-
198
-
199
-
200
-
201
-
202
-
203
-
204
-
205
-
206
-
207
-
208
-
209
-
210
-
211
-
212
-
213
-
214
-
215
-
216
-
217
-
218
-
219
-
220
-
221
-
222
-
223
-
224
-
225
-
226
-
227
-
228
-
229
-
230
-
231
-
232
-
233
-
234
-
235
-
236
-
237
-
238
-
239
-
240
-
241
-
242
-
243
-
244
 |
 |

2009 REGISTRATION DOCUMENT SCHNEIDER ELECTRIC106
BUSINESS REVIEW
4TRENDS IN SCHNEIDER ELECTRIC’S CORE MARKETS
>
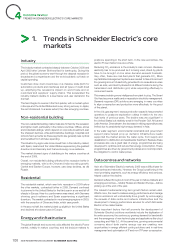
1. Trends in Schneider Electric’s core
markets
Industry
The industry market contracted sharply between October2008 and
April2009 after Lehman Brothers fi led for bankruptcy. During this
period, the global economy went through the deepest recession in
decades and companies around the world suddenly cut back on
capital spending.
Customers drew down inventories on a massive scale (both for
automation products and machines) and all types of credit dried
up, amplifying the recession’s impact on world trade and on
customers’and suppliers’ supply chains. This accelerated the
industry market’s decline to a level below end-user demand in the
fi rst half.
The trend began to reverse in the third quarter, with a modest upturn
in Europe and the United States and a very strong recovery in Japan,
the rest of Asia and, to a lesser extent, the other emerging countries.
Non-residential building
The non-residential building market was also hit hard by the recession
and tighter credit, particularly in the mature countries. Offi ces, stores
and industrial buildings, which depend on corporate investment, saw
the sharpest declines, while administrative buildings, hospitals and
schools held up better as these segments are generally less cyclical
and benefi ted from stimulus spending.
The situation by region was more mixed than in the industry market,
with Spain, Ireland and the United States experiencing the greatest
downturns and Germany and France showing more resilience.
The market showed signs of stabilising in the mature countries at
the end of 2009.
Overall, non-residential building withstood the recession better in
emerging markets, with both China and India recording growth.
Central and Eastern Europe, however, saw deep declines, as did
Russia.
Residential
The residential market, which went into recession in 2008 before
the other markets, contracted further in 2009. Demand continued
to plummet in the United States for the third year in a row and fell off
sharply in Europe. Here too, performance was mixed, with Germany
showing good resilience and Spain experiencing a significant
downturn. The market contracted in most emerging regions in 2009,
with the exception of China and India, which saw growth.
In the second half, the market picked up slightly in the United States
and declined at a slower pace in Europe.
Energy and infrastructure
The global fi nancial and economic crisis affected the electric Power
market, notably in mature countries, and led decision-makers to
postpone spending in the short term. In the new economies, the
electric Power market rose as a whole.
Reducing CO2 emissions is the industry’s main concern. Because
electricity has to be produced as it is being used, stand-by plants
have to be brought on line when demand exceeds forecasts.
Very often, these are coal-fi red plants that generate CO2. More
sophisticated management systems are needed to take into account
the growing amount of electricity generated from renewable sources
such as solar, wind and hydroelectric at different locations along the
transmission and distribution grid, while responding effectively to
consumers’needs.
This means including more intelligence from plant to plug. The Smart
Grid has become a reality and a necessity in electricity management.
Demand response (DR) solutions are emerging in many countries
to align consumption and production more effectively, for the good
of the planet.
In the oil & gas segment, excess production capacity has prompted
operators to postpone exploration outlays in relation to the very
high levels of previous years. The decline was very signifi cant in
the United States but relatively small in the Persian Gulf, Africa and
Latin America. Downstream, the decrease in refi ning expenditure was
limited due to persistently high energy demand in Asia.
In the water segment, environmental constraints and government
support plans helped prop up demand. Infrastructure needs
supported the market across the water cycle, from supply and
desalination to distribution and wastewater treatment. Because these
processes also use a great deal of energy, programmes are being
developed to optimise and reduce their energy consumption. These
programmes are driven by government policies and, most important,
the obligation to control water prices.
Data centres and networks
As in all of Schneider Electric’s markets, 2009 was a diffi cult year for
data centres and networks. However, the Group’s positioning in the
most promising segments, such as energy effi ciency and services,
helped cushion the decline.
Demand suffered throughout most of the year in mature markets and
emerging economies—notably Russia and Eastern Europe—before
picking up at the end of the year.
The market’s fundamental long-term growth factors remain valid.
What’s more, the need to measure energy performance and manage
carbon emissions will undoubtedly drive growth by encouraging
the renewal of data centre and network infrastructure and the
development of energy performance services for which Schneider
Electric is the market leader.
Other important factors that will promote the development of
Schneider Electric’s solutions worldwide include the digitis ation of
the entire economy, the continuous, growing demand for bandwidth
and the emergence of new technologies and applications like cloud
computing and Web 3.0. At the same time, growing environmental
concerns about data centre energy use are creating new
opportunities in energy effi cient cooling solutions and in real-time
management and optimisation of IT and non-IT Power consumption.