APC 2009 Annual Report Download - page 63
Download and view the complete annual report
Please find page 63 of the 2009 APC annual report below. You can navigate through the pages in the report by either clicking on the pages listed below, or by using the keyword search tool below to find specific information within the annual report.-
 1
1 -
2
-
3
-
4
-
5
-
6
-
7
-
8
-
9
-
10
-
11
-
12
-
13
-
14
-
15
-
16
-
17
-
18
-
19
-
20
-
21
-
22
-
23
-
24
-
25
-
26
-
27
-
28
-
29
-
30
-
31
-
32
-
33
-
34
-
35
-
36
-
37
-
38
-
39
-
40
-
41
-
42
-
43
-
44
-
45
-
46
-
47
-
48
-
49
-
50
-
51
-
52
-
 53
53 -
 54
54 -
 55
55 -
 56
56 -
 57
57 -
 58
58 -
 59
59 -
 60
60 -
 61
61 -
 62
62 -
 63
63 -
 64
64 -
 65
65 -
 66
66 -
 67
67 -
 68
68 -
 69
69 -
 70
70 -
 71
71 -
 72
72 -
 73
73 -
74
-
75
-
76
-
77
-
78
-
79
-
80
-
81
-
82
-
83
-
84
-
85
-
86
-
87
-
88
-
89
-
90
-
91
-
92
-
93
-
94
-
95
-
96
-
97
-
98
-
99
-
100
-
101
-
102
-
103
-
104
-
105
-
106
-
107
-
108
-
109
-
110
-
111
-
112
-
113
-
114
-
115
-
116
-
117
-
118
-
119
-
120
-
121
-
122
-
123
-
124
-
125
-
126
-
127
-
128
-
129
-
130
-
131
-
132
-
133
-
134
-
135
-
136
-
137
-
138
-
139
-
140
-
141
-
142
-
143
-
144
-
145
-
146
-
147
-
148
-
149
-
150
-
151
-
152
-
153
-
154
-
155
-
156
-
157
-
158
-
159
-
160
-
161
-
162
-
163
-
164
-
165
-
166
-
167
-
168
-
169
-
170
-
171
-
172
-
173
-
174
-
175
-
176
-
177
-
178
-
179
-
180
-
181
-
182
-
183
-
184
-
185
-
186
-
187
-
188
-
189
-
190
-
191
-
192
-
193
-
194
-
195
-
196
-
197
-
198
-
199
-
200
-
201
-
202
-
203
-
204
-
205
-
206
-
207
-
208
-
209
-
210
-
211
-
212
-
213
-
214
-
215
-
216
-
217
-
218
-
219
-
220
-
221
-
222
-
223
-
224
-
225
-
226
-
227
-
228
-
229
-
230
-
231
-
232
-
233
-
234
-
235
-
236
-
237
-
238
-
239
-
240
-
241
-
242
-
243
-
244
 |
 |

2009 REGISTRATION DOCUMENT SCHNEIDER ELECTRIC 61
SUSTAINABLE DEVELOPMENT
2
SOCIAL PERFORMANCE
Indicators
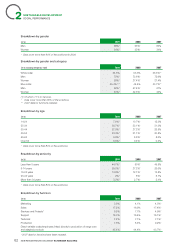
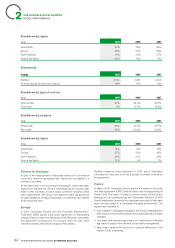
Workforce
Total workforce 2009 2008 2007
Average workforce* 116,065 126,481 119,340
Fixed-term and open-ended contracts ▲104,853 113,904 111,858**
Average production staff* 55,125 59,964 52,360**
Average non-production staff 60,940 66,518 66,980
New hires*** 8,977 20,995 26,972
Departures*** 17,663 21,504 21,117
* Including staff from temporary employment agencies.
** 2007 data for temporary staff have been restated.
*** Acquisitions/disposals and temporary staff are not taken into account in the calculation.
▲ 2009 audited indicators
Breakdown by region (based on year-end spot headcount)
(in %) 2009 2008 2007
Asia-Pacifi c 25% 25% 25%*
Europe 43% 42% 42%*
North America 24% 25% 26%*
Rest of the World 8% 8% 7%*
* 2007 data for temporary staff have been restated.
Countries with the most employees
(in %) 2009 % vs 2008
France 18% -6%
United States 17% -10%
China 10% -9%
Mexico 6% -16%
India 5% +2%
Spain 3% -20%
Australia 3% -13%
Germany 3% -8%
Russia 3% -6%
England 3% -11%
Italy 2% -6%
Indonesia 2% -11%
Areas covered by the agreements
Terms and mandates of trade union delegations (1).
Continuation of employee representative bodies and trade unions in
Schneider Electric companies (1).
Forward planning of jobs, occupations and skills on the French
territory (5).
Employee incentive schemes (3).
Areas covered by the amendments
Roll-out of the Corporate Savings Scheme (2).
Pooling of the existing legal profi t-sharing schemes (1).
Forward planning of jobs, occupations and skills (1).
All in all, 119 negotiating group and monitoring committee meetings
were held in the framework of these agreements during the year (or
the equivalent to 81.5 days) .