APC 2009 Annual Report Download - page 64
Download and view the complete annual report
Please find page 64 of the 2009 APC annual report below. You can navigate through the pages in the report by either clicking on the pages listed below, or by using the keyword search tool below to find specific information within the annual report.-
 1
1 -
2
-
3
-
4
-
5
-
6
-
7
-
8
-
9
-
10
-
11
-
12
-
13
-
14
-
15
-
16
-
17
-
18
-
19
-
20
-
21
-
22
-
23
-
24
-
25
-
26
-
27
-
28
-
29
-
30
-
31
-
32
-
33
-
34
-
35
-
36
-
37
-
38
-
39
-
40
-
41
-
42
-
43
-
44
-
45
-
46
-
47
-
48
-
49
-
50
-
51
-
52
-
53
-
 54
54 -
 55
55 -
 56
56 -
 57
57 -
 58
58 -
 59
59 -
 60
60 -
 61
61 -
 62
62 -
 63
63 -
 64
64 -
 65
65 -
 66
66 -
 67
67 -
 68
68 -
 69
69 -
 70
70 -
 71
71 -
 72
72 -
 73
73 -
 74
74 -
75
-
76
-
77
-
78
-
79
-
80
-
81
-
82
-
83
-
84
-
85
-
86
-
87
-
88
-
89
-
90
-
91
-
92
-
93
-
94
-
95
-
96
-
97
-
98
-
99
-
100
-
101
-
102
-
103
-
104
-
105
-
106
-
107
-
108
-
109
-
110
-
111
-
112
-
113
-
114
-
115
-
116
-
117
-
118
-
119
-
120
-
121
-
122
-
123
-
124
-
125
-
126
-
127
-
128
-
129
-
130
-
131
-
132
-
133
-
134
-
135
-
136
-
137
-
138
-
139
-
140
-
141
-
142
-
143
-
144
-
145
-
146
-
147
-
148
-
149
-
150
-
151
-
152
-
153
-
154
-
155
-
156
-
157
-
158
-
159
-
160
-
161
-
162
-
163
-
164
-
165
-
166
-
167
-
168
-
169
-
170
-
171
-
172
-
173
-
174
-
175
-
176
-
177
-
178
-
179
-
180
-
181
-
182
-
183
-
184
-
185
-
186
-
187
-
188
-
189
-
190
-
191
-
192
-
193
-
194
-
195
-
196
-
197
-
198
-
199
-
200
-
201
-
202
-
203
-
204
-
205
-
206
-
207
-
208
-
209
-
210
-
211
-
212
-
213
-
214
-
215
-
216
-
217
-
218
-
219
-
220
-
221
-
222
-
223
-
224
-
225
-
226
-
227
-
228
-
229
-
230
-
231
-
232
-
233
-
234
-
235
-
236
-
237
-
238
-
239
-
240
-
241
-
242
-
243
-
244
 |
 |

2009 REGISTRATION DOCUMENT SCHNEIDER ELECTRIC62
SUSTAINABLE DEVELOPMENT
2SOCIAL PERFORMANCE
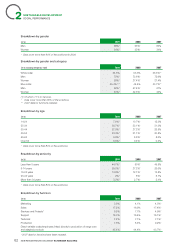
Breakdown by gender
(in %) 2009 2008 2007
Men 66%* 65%* 66%
Women 34%* 35%* 34%
* Data cover more than 80 % of the workforce in 2009.
Breakdown by gender and category
(in % excluding temporary staff) 2009 2008 2007
White collar 54.6% 55.6% 56.3%**
Men 72%* 72.6%* 72.6%
Women 28%* 27.4%* 27.4%
Blue collar 45.4%(1)* 44.4% 43.7%**
Men 60%* 57.4%* 57%
Women 40%* 42.6%* 43%
(1) Of which 7.1% in Services.
* Data cover more than 80 % of the workforce .
** 2007 data for functions restated.
Breakdown by age
(in %) 2009 2008 2007
14-24 7.9%* 10.7%* 12.3%
25-34 30.7%* 32.1%* 31.3%
35-44 27.9%* 27.2%* 26.5%
45-54 23.3%* 21.1%* 20.8%
55-64 9.8%* 8.5%* 8.6%
Over 64 0.5%* 0.4%* 0.5%
* Data cover more than 80% of the workforce.
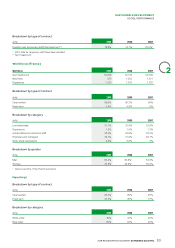
Breakdown by seniority
(in %) 2009 2008 2007
Less than 5years 44.7%* 50%* 49.5%
5-14years 29.2%* 27.2%* 26.6%
15-24years 13.9%* 12.1%* 12.8%
25-34years 9%* 8%* 8.7%
More than 34years 3.2%* 2.7%* 2.4%
* Data cover more than 80% of the workforce.
Breakdown by function
(in %) 2009 2008 2007
Marketing 3.9% 4.1% 4.3% *
Sales 17.2% 16.9% 17.4%*
Services and Projects* 9.5% 7.7% 4.9%*
Support 16.3% 16.4% 16.1%*
Technical 7.2% 7.1% 7.1%*
Production 7.6% 8.4% 9.2%*
Direct variable costs/employees linked directly to production of range core
and adapted products 45.4% 44.4% 43.7%*
* 2007 data for functions have been restated.