APC 2009 Annual Report Download - page 166
Download and view the complete annual report
Please find page 166 of the 2009 APC annual report below. You can navigate through the pages in the report by either clicking on the pages listed below, or by using the keyword search tool below to find specific information within the annual report.-
 1
1 -
2
-
3
-
4
-
5
-
6
-
7
-
8
-
9
-
10
-
11
-
12
-
13
-
14
-
15
-
16
-
17
-
18
-
19
-
20
-
21
-
22
-
23
-
24
-
25
-
26
-
27
-
28
-
29
-
30
-
31
-
32
-
33
-
34
-
35
-
36
-
37
-
38
-
39
-
40
-
41
-
42
-
43
-
44
-
45
-
46
-
47
-
48
-
49
-
50
-
51
-
52
-
53
-
54
-
55
-
56
-
57
-
58
-
59
-
60
-
61
-
62
-
63
-
64
-
65
-
66
-
67
-
68
-
69
-
70
-
71
-
72
-
73
-
74
-
75
-
76
-
77
-
78
-
79
-
80
-
81
-
82
-
83
-
84
-
85
-
86
-
87
-
88
-
89
-
90
-
91
-
92
-
93
-
94
-
95
-
96
-
97
-
98
-
99
-
100
-
101
-
102
-
103
-
104
-
105
-
106
-
107
-
108
-
109
-
110
-
111
-
112
-
113
-
114
-
115
-
116
-
117
-
118
-
119
-
120
-
121
-
122
-
123
-
124
-
125
-
126
-
127
-
128
-
129
-
130
-
131
-
132
-
133
-
134
-
135
-
136
-
137
-
138
-
139
-
140
-
141
-
142
-
143
-
144
-
145
-
146
-
147
-
148
-
149
-
150
-
151
-
152
-
153
-
154
-
155
-
 156
156 -
 157
157 -
 158
158 -
 159
159 -
 160
160 -
 161
161 -
 162
162 -
 163
163 -
 164
164 -
 165
165 -
 166
166 -
 167
167 -
 168
168 -
 169
169 -
 170
170 -
 171
171 -
 172
172 -
 173
173 -
 174
174 -
 175
175 -
 176
176 -
177
-
178
-
179
-
180
-
181
-
182
-
183
-
184
-
185
-
186
-
187
-
188
-
189
-
190
-
191
-
192
-
193
-
194
-
195
-
196
-
197
-
198
-
199
-
200
-
201
-
202
-
203
-
204
-
205
-
206
-
207
-
208
-
209
-
210
-
211
-
212
-
213
-
214
-
215
-
216
-
217
-
218
-
219
-
220
-
221
-
222
-
223
-
224
-
225
-
226
-
227
-
228
-
229
-
230
-
231
-
232
-
233
-
234
-
235
-
236
-
237
-
238
-
239
-
240
-
241
-
242
-
243
-
244
 |
 |

2009 REGISTRATION DOCUMENT SCHNEIDER ELECTRIC164
CONSOLIDATED FINANCIAL STATEMENTS
5NOTES TO THE CONSOLIDATED FINANCIAL STATEMENTS
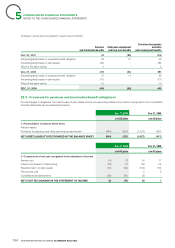
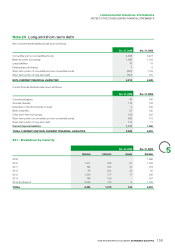
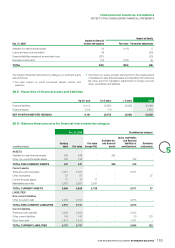
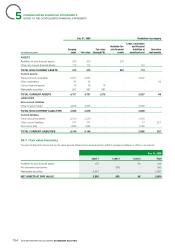
Dec. 31, 2008 Breakdown by category
(in millions of euros)
Carrying
value Fair value Fair value
through P&L
Available-for-
sale fi nancial
assets
Loans, receivables
and fi nancial
liabilities at
amortised cost Derivative
instruments
ASSETS
Available-for-sale fi nancial assets 200 200 - 200 - -
Other non-current fi nancial assets 113 113 - - 113 -
TOTAL NON-CURRENT ASSETS 313 313 -200 113 -
Current assets:
Trade accounts receivable 3,537 3,537 - - 3,537 -
Other receivables 95 95 - - - 95
Current fi nancial assets 78 78 78 -
Marketable securities 997 997 997 - - -
TOTAL CURRENT ASSETS 4,707 4,707 1,075 -3,537 95
LIABILITIES
Non-current liabilities
Other long-term debt 4,639 4,576 - - 4,639 -
TOTAL NON-CURRENT LIABILITIES 4,639 4,576 --4,639 -
Current liabilites
Trade accounts payable 2,312 2,312 - - 2,312 -
Other current liabilities 271 271 - - 14 257
Short-term debt 1,566 1,566 - - 1,566 -
TOTAL CURRENT LIABILITIES 4,149 4,149 --3,892 257
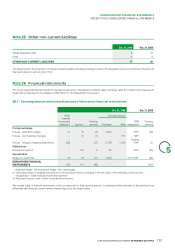
26.7 - Fair value hierarchy
The split of fi nancial instruments by fair value level as stated in the amendments to IFRS7 released on March 5, 2009, is as follows:
Dec. 31, 2009
Level 1 Level 2 Level 3 Total
Available-for-sale fi nancial assets 179 - 66 245
Net derivative instruments - (66) - (66)
Marketable securities 2,681 - - 2,681
NET ASSETS AT FAIR VALUE 2,860 (66) 66 2,860