APC 2009 Annual Report Download - page 215
Download and view the complete annual report
Please find page 215 of the 2009 APC annual report below. You can navigate through the pages in the report by either clicking on the pages listed below, or by using the keyword search tool below to find specific information within the annual report.-
 1
1 -
2
-
3
-
4
-
5
-
6
-
7
-
8
-
9
-
10
-
11
-
12
-
13
-
14
-
15
-
16
-
17
-
18
-
19
-
20
-
21
-
22
-
23
-
24
-
25
-
26
-
27
-
28
-
29
-
30
-
31
-
32
-
33
-
34
-
35
-
36
-
37
-
38
-
39
-
40
-
41
-
42
-
43
-
44
-
45
-
46
-
47
-
48
-
49
-
50
-
51
-
52
-
53
-
54
-
55
-
56
-
57
-
58
-
59
-
60
-
61
-
62
-
63
-
64
-
65
-
66
-
67
-
68
-
69
-
70
-
71
-
72
-
73
-
74
-
75
-
76
-
77
-
78
-
79
-
80
-
81
-
82
-
83
-
84
-
85
-
86
-
87
-
88
-
89
-
90
-
91
-
92
-
93
-
94
-
95
-
96
-
97
-
98
-
99
-
100
-
101
-
102
-
103
-
104
-
105
-
106
-
107
-
108
-
109
-
110
-
111
-
112
-
113
-
114
-
115
-
116
-
117
-
118
-
119
-
120
-
121
-
122
-
123
-
124
-
125
-
126
-
127
-
128
-
129
-
130
-
131
-
132
-
133
-
134
-
135
-
136
-
137
-
138
-
139
-
140
-
141
-
142
-
143
-
144
-
145
-
146
-
147
-
148
-
149
-
150
-
151
-
152
-
153
-
154
-
155
-
156
-
157
-
158
-
159
-
160
-
161
-
162
-
163
-
164
-
165
-
166
-
167
-
168
-
169
-
170
-
171
-
172
-
173
-
174
-
175
-
176
-
177
-
178
-
179
-
180
-
181
-
182
-
183
-
184
-
185
-
186
-
187
-
188
-
189
-
190
-
191
-
192
-
193
-
194
-
195
-
196
-
197
-
198
-
199
-
200
-
201
-
202
-
203
-
204
-
 205
205 -
 206
206 -
 207
207 -
 208
208 -
 209
209 -
 210
210 -
 211
211 -
 212
212 -
 213
213 -
 214
214 -
 215
215 -
 216
216 -
 217
217 -
 218
218 -
 219
219 -
 220
220 -
 221
221 -
 222
222 -
 223
223 -
 224
224 -
 225
225 -
226
-
227
-
228
-
229
-
230
-
231
-
232
-
233
-
234
-
235
-
236
-
237
-
238
-
239
-
240
-
241
-
242
-
243
-
244
 |
 |

2009 REGISTRATION DOCUMENT SCHNEIDER ELECTRIC 213
GENERAL PRESENTATION OF SCHNEIDER ELECTRIC SA
7
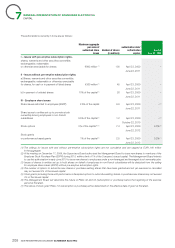
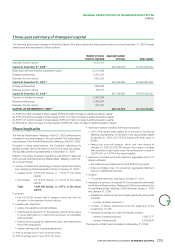
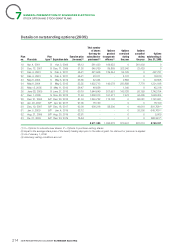
STOCK OPTION AND STOCK GRANT PLANS
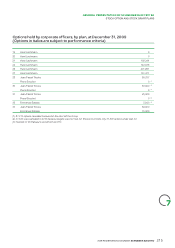
Stock option plan details
Plan
no. Plan date
Initial
number
of
grantees
Initial
number of
options
Options
granted to
corporate
offi cers
Exercise
price
(ineuros) Vesting conditions
% of
target
met Cancelled
options(1)
Options
outstanding
at Dec. 31,
2009(2)
19 Apr. 4, 2001 1,050 1,557,850 205,500 68.13 None NA NA 0(3)
20 Dec. 12, 2001 180 1,600,000 100,000 51.26 100% - 2004 revenue
andoperating profi t
89.0 166,800 0(3)
21 Feb. 5, 2003 433 2,000,000 150,000 45.21 50% - 2005 operating
profi t and return on capital
employed
84.0 141,900 427,781
22 Feb. 5, 2003 111 111,000 - 45.21 None - reserved
forwinners
oftheNEW2004 trophies
NA NA 18,570
23 May6, 2004 107 107,000 - 55.55 None - reserved
forwinners
oftheNEW2004 trophies
NA NA 39,598
24 May6, 2004 402 2,060,700 150,000 55.55 50% - operating margin.
1/3 per year over 2004,
2005 and 2006
88.9 94,300 1,321,048
25 May12, 2005 157 138,500 - 56.47 None - reserved
forwinners
of the NEW2004 trophies
NA NA 45,316
26 June28, 2005 458 2,003,800 200,000 60.19 50% - 2005 and 2006
revenue and operating
margin
100 0 1,742,754
27 Dec. 1, 2005 419 1,614,900 150,000 71.40 50% - 2006 and 2007
revenue and operating
margin
100 0 1,548,404
28 Dec. 21, 2006 489 1,257,120 112,000 81.34 50% - 2007 and 2008
revenue and operating
margin
100 0 1,191,661
29 Apr. 23, 2007 43 83,150 - 97.05 50% - 2007 and 2008
revenue and operating
margin
100 0 76,150
30 Dec. 19, 2007 542 944,926 88,200 92.00 50% - 2008 and 2009
revenue and operating
margin
0(4) 891,706
31 Jan. 5, 2009 328 679,000 68,500 52.12 50%/ 100% for Mgt.
Board members - 2011 (6)
operating margin and EPS
for 2009-2011 compared
to a benchmark selection(5)
- - 645,700
32 Aug. 21, 2009 1 5,000 5,000 62.61 None - - 5,000
33 Dec. 21, 2009 391 826,343 65,000 75.84 50%/ 100% for Mgt.
Board members - 2010
and 2011 (6) operating
margin and share of 2011
revenue generated in new
economies
- - 826,343
14,989,289 1,294,200 - 403,000 8,780,031
(1) Number of options cancelled because the targets were not met (plans 20 to 30).
(2) Number of options outstanding after deducting all options cancelled and exercised since the plan’s inception.
(3) Plan 19: 561,430 non-exercised options expired at the end of the plan’s life (12,118 for plan 20).
(4) Plan 30: 471,246 options were cancelled in 2010 because the targets were not met.
(5) Based on a predetermined, set list of 11 peer competitors.
(6) Excluding restructuring costs.