APC 2009 Annual Report Download - page 111
Download and view the complete annual report
Please find page 111 of the 2009 APC annual report below. You can navigate through the pages in the report by either clicking on the pages listed below, or by using the keyword search tool below to find specific information within the annual report.-
 1
1 -
2
-
3
-
4
-
5
-
6
-
7
-
8
-
9
-
10
-
11
-
12
-
13
-
14
-
15
-
16
-
17
-
18
-
19
-
20
-
21
-
22
-
23
-
24
-
25
-
26
-
27
-
28
-
29
-
30
-
31
-
32
-
33
-
34
-
35
-
36
-
37
-
38
-
39
-
40
-
41
-
42
-
43
-
44
-
45
-
46
-
47
-
48
-
49
-
50
-
51
-
52
-
53
-
54
-
55
-
56
-
57
-
58
-
59
-
60
-
61
-
62
-
63
-
64
-
65
-
66
-
67
-
68
-
69
-
70
-
71
-
72
-
73
-
74
-
75
-
76
-
77
-
78
-
79
-
80
-
81
-
82
-
83
-
84
-
85
-
86
-
87
-
88
-
89
-
90
-
91
-
92
-
93
-
94
-
95
-
96
-
97
-
98
-
99
-
100
-
 101
101 -
 102
102 -
 103
103 -
 104
104 -
 105
105 -
 106
106 -
 107
107 -
 108
108 -
 109
109 -
 110
110 -
 111
111 -
 112
112 -
 113
113 -
 114
114 -
 115
115 -
 116
116 -
 117
117 -
 118
118 -
 119
119 -
 120
120 -
 121
121 -
122
-
123
-
124
-
125
-
126
-
127
-
128
-
129
-
130
-
131
-
132
-
133
-
134
-
135
-
136
-
137
-
138
-
139
-
140
-
141
-
142
-
143
-
144
-
145
-
146
-
147
-
148
-
149
-
150
-
151
-
152
-
153
-
154
-
155
-
156
-
157
-
158
-
159
-
160
-
161
-
162
-
163
-
164
-
165
-
166
-
167
-
168
-
169
-
170
-
171
-
172
-
173
-
174
-
175
-
176
-
177
-
178
-
179
-
180
-
181
-
182
-
183
-
184
-
185
-
186
-
187
-
188
-
189
-
190
-
191
-
192
-
193
-
194
-
195
-
196
-
197
-
198
-
199
-
200
-
201
-
202
-
203
-
204
-
205
-
206
-
207
-
208
-
209
-
210
-
211
-
212
-
213
-
214
-
215
-
216
-
217
-
218
-
219
-
220
-
221
-
222
-
223
-
224
-
225
-
226
-
227
-
228
-
229
-
230
-
231
-
232
-
233
-
234
-
235
-
236
-
237
-
238
-
239
-
240
-
241
-
242
-
243
-
244
 |
 |

2009 REGISTRATION DOCUMENT SCHNEIDER ELECTRIC 109
BUSINESS REVIEW
4
REVIEW OF THE CONSOLIDATED FINANCIAL STATEMENTS
term internal fi nancing, which had a non-recurring negative impact
of EUR 13million.
The interest component of pension and other post-employment
benefi t plan costs represented a net charge of EUR 56million versus
EUR 19million in 2008, primarily due to a lower expected return on
plan assets.
Other fi nancial expenses, net totalled EUR 34million and primarily
included bank facility arrangement fees.
Income tax
The effective tax rate stood at 24.3% compared with 24.5% in 2008.
Share of profit/(losses) of associates
The Group’s share of profi ts and losses of associates came to a net
loss of EUR 21million at December 31, 2009. This item primarily
comprises the Group’s share in the profits and losses of the
FujiElectric joint venture in Japan, which was accounted for by the
equity method from September2008. In 2008, this item showed a
net profi t of EUR 12million stemming primarily from the Delixi Electric
joint venture, which was accounted for by the equity method. Since
January 1, 2009, Delixi Electric has been proportionally consolidated.
Minority interests
Minority interests totalled EUR 42million in 2009 versus EUR 41million
in 2008. Minority interests mainly correspond to the share of profi t
attributable to minority shareholders of a number of Chinese
companies and of Feller in Switzerland.
Profit attributable to equity holders
oftheparent
Profit attributable to equity holders of the parent amounted to
EUR 852million. This represents a 49% decrease from 2008,
primarily attributable to the decline in operating profi t.
Earnings per share
Earning per share came to EUR 3.43 versus EUR 7.02 in 2008.
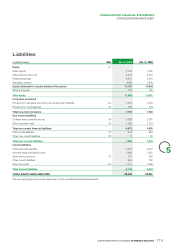
Review of balance sheet
and cash flow statement items
Total assets stood at EUR 25,649million at December 31, 2009, up
3% from the previous year-end. Non- current assets amounted to
EUR 15,917million and represented 62% of total assets.
Goodwill
Goodwill rose by EUR 69million over the period to EUR 8,611million,
or 34% of total assets. Acquisitions added EUR 66million, while the
proportional consolidation of Delixi Electric led to the reclassifi cation
of EUR 136million in goodwill previously accounted for by the
equity method. Changes in exchange rates reduced goodwill by
EUR 26million. An impairment test on CST led to a EUR 90million
write-down of the related goodwill at December 31, 2009.
Property, plant and equipment and intangible
assets
Property, plant and equipment and intangible assets came to
EUR 5,883million, or 23% of total assets, down 1% from end-2008.
Intangible assets
Trademarks amounted to EUR 2,288million as of December 31,
2009, on a par with EUR 2,331million at end-2008. Gross capitalised
development costs totalled EUR 842million (EUR 599million net),
refl ecting the capitalisation of costs related to current projects in an
amount of EUR 211million. Other intangible assets, net, consisting
primarily of customer lists recognised on acquisition, software
and patents, decreased by EUR 150million over the year primarily
due to amortisation and impairment charges in an amount of
EUR 188million.
Property, plant and equipment
Property, plant and equipment came to EUR 1,964million, compared
with EUR 1,970million at December 31, 2008.
Investments in associates
Investments in associates declined by EUR 206million over the year
to EUR 75million. The decrease refl ects:
•the loss posted by Fuji Electric FA Components & Systems,
corresponding to EUR 22million for the Group’s 37% share;
•the removal of jointly controlled Delixi Electric (EUR 182million),
which is now proportionally consolidated.
Non-current financial assets
Non-current fi nancial assets, primarily listed and unlisted equity
instruments and loans and receivables related to investments, totalled
EUR 347million at December 31, 2008, up from EUR 313million at
end-2008. The increase primarily refl ects the increase in value of AXA
shares, in an amount of EUR 20million, and of unlisted shares, in an
amount of EUR 14million.
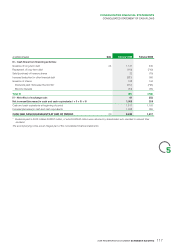
Cash and net debt
Net cash provided by operating activities before changes in
operating assets and liabilities came to EUR 1,734million versus
EUR 2,500million in 2008, and represented 11.0% of revenue
compared with 13.7% the year before.
Changes in operating working capital generated EUR 813million in
cash, refl ecting a contraction in trade receivables in line with the
decline in revenue and good inventory management.
In all, net cash provided by operating activities totalled
EUR 2,547million compared with EUR 2,428million in 2008,
demonstrating the Group’s ability to generate cash despite a
signifi cant decline in net profi t.
Net capital expenditure, which includes capitalised development
projects, represented an outlay of EUR 576million, or 3.6% of
revenue, compared with EUR 693million (or 3.8%) in 2008.
The year’s few acquisitions used only EUR 63million compared with
EUR 598million in 2008, net of the cash acquired.
The sale of treasury stock on exercise of stock options represented
a net inflow of EUR 22million compared with a net outflow of
EUR 70million in 2008 related to net purchases. Dividends paid