APC 2009 Annual Report Download - page 132
Download and view the complete annual report
Please find page 132 of the 2009 APC annual report below. You can navigate through the pages in the report by either clicking on the pages listed below, or by using the keyword search tool below to find specific information within the annual report.-
 1
1 -
2
-
3
-
4
-
5
-
6
-
7
-
8
-
9
-
10
-
11
-
12
-
13
-
14
-
15
-
16
-
17
-
18
-
19
-
20
-
21
-
22
-
23
-
24
-
25
-
26
-
27
-
28
-
29
-
30
-
31
-
32
-
33
-
34
-
35
-
36
-
37
-
38
-
39
-
40
-
41
-
42
-
43
-
44
-
45
-
46
-
47
-
48
-
49
-
50
-
51
-
52
-
53
-
54
-
55
-
56
-
57
-
58
-
59
-
60
-
61
-
62
-
63
-
64
-
65
-
66
-
67
-
68
-
69
-
70
-
71
-
72
-
73
-
74
-
75
-
76
-
77
-
78
-
79
-
80
-
81
-
82
-
83
-
84
-
85
-
86
-
87
-
88
-
89
-
90
-
91
-
92
-
93
-
94
-
95
-
96
-
97
-
98
-
99
-
100
-
101
-
102
-
103
-
104
-
105
-
106
-
107
-
108
-
109
-
110
-
111
-
112
-
113
-
114
-
115
-
116
-
117
-
118
-
119
-
120
-
121
-
 122
122 -
 123
123 -
 124
124 -
 125
125 -
 126
126 -
 127
127 -
 128
128 -
 129
129 -
 130
130 -
 131
131 -
 132
132 -
 133
133 -
 134
134 -
 135
135 -
 136
136 -
 137
137 -
 138
138 -
 139
139 -
 140
140 -
 141
141 -
 142
142 -
143
-
144
-
145
-
146
-
147
-
148
-
149
-
150
-
151
-
152
-
153
-
154
-
155
-
156
-
157
-
158
-
159
-
160
-
161
-
162
-
163
-
164
-
165
-
166
-
167
-
168
-
169
-
170
-
171
-
172
-
173
-
174
-
175
-
176
-
177
-
178
-
179
-
180
-
181
-
182
-
183
-
184
-
185
-
186
-
187
-
188
-
189
-
190
-
191
-
192
-
193
-
194
-
195
-
196
-
197
-
198
-
199
-
200
-
201
-
202
-
203
-
204
-
205
-
206
-
207
-
208
-
209
-
210
-
211
-
212
-
213
-
214
-
215
-
216
-
217
-
218
-
219
-
220
-
221
-
222
-
223
-
224
-
225
-
226
-
227
-
228
-
229
-
230
-
231
-
232
-
233
-
234
-
235
-
236
-
237
-
238
-
239
-
240
-
241
-
242
-
243
-
244
 |
 |

2009 REGISTRATION DOCUMENT SCHNEIDER ELECTRIC130
CONSOLIDATED FINANCIAL STATEMENTS
5NOTES TO THE CONSOLIDATED FINANCIAL STATEMENTS
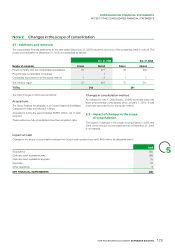
Note3
Segment information
Effective January 1, 2010, the Group has re-organised into fi ve
Businesses (Power, Industry, IT, Buildings and customised Sensors
& Technologies).
Because this new organisation was gradually deployed during 2009
and was effective on the reporting date, segment information for
2009 refl ects the changes in accordance with IFRS8 – Operating
Segments.
However, because information on the new basis of segmentation
is not available for the year ended December 31, 2008, segment
information is provided on the old basis for 2009 and 2008 for
purposes of comparison, in accordance with paragraph30 of IFRS8.
The fi ve Businesses are:
•Power, which includes Medium and Low Voltage, Installation
Systems and Control, Renewable Energies and four end-
customer segments: Utilities, Marine, Residential and Oil & Gas;
•Industry, which includes Automation & Control and three end-
customer segments: OEMs, Water Treatment and Mining,
Minerals & Metals;
•IT, which covers Critical Power & Cooling Services and two end-
customer segments: Data Centres and Financial Services;
•Buildings, which includes Building Automation and Security and
four end-customer segments: Hotels, Hospitals, Offi ce Buildings
and Retail Buildings;
•Custom Sensors & Technologies, a mainly technological
business focused on customers in the Automotive, Aeronautic
and Manufacturing industries.
Data concerning General Management that cannot be allocated to a
particular segment are presented under “Holding Company”.
Operating segment data is identical to that presented to the
Management Board, which has been identifi ed as the main decision-
making body for allocating resources and evaluating segment
performance. Performance assessments are notably based on
Earnings Before Interest, Taxes, amortisation of purchase accounting
intangibles and Restructuring costs (EBITAR). Share-based payment
is presented under “Holding Company”. The Management Board
does not review assets and liabilities by Business.
The same accounting principles governing the consolidated fi nancial
statements apply to segment data.
Details are provided in Chapter4 of the Registration Document
(Business Review).
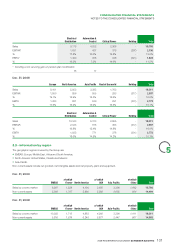
3.1 - Information by operating segment
Dec. 31, 2009
Power
Business Industry
Business IT Business Buildings
Business CST Holding Total
Sales 9,137 2,665 2,366 1,268 357 - 15,793
EBITAR* 1,639 266 375 132 20 (297) 2,136
% 17.9% 10.0% 15.8% 10.4% 5.6% - 13.5%
EBITA* 1,493 189 346 121 (4) (321) 1,823
% 16.3% 7.1% 14.6% 9.5% -1.1% - 11.5%
* including a non recurring gain on pension plan modifi cation:
81 11
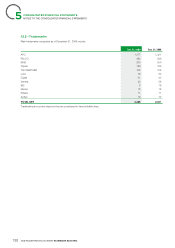
3.2 - Comparative information
Dec. 31, 2009
Europe North America Asia Pacifi c Rest of the
world Holding Total
Sales 6,423 4,356 3,278 1,736 - 15,793
EBITAR* 967 656 526 284 (297) 2,136
% 15.1% 15.1% 16.0% 16.4% - 13.5%
EBITA* 776 595 500 273 (321) 1,823
% 12.1% 13.7% 15.3% 15.7% - 11.5%
* including a non recurring gain on pension plan modifi cation:
92