APC 2009 Annual Report Download - page 130
Download and view the complete annual report
Please find page 130 of the 2009 APC annual report below. You can navigate through the pages in the report by either clicking on the pages listed below, or by using the keyword search tool below to find specific information within the annual report.-
 1
1 -
2
-
3
-
4
-
5
-
6
-
7
-
8
-
9
-
10
-
11
-
12
-
13
-
14
-
15
-
16
-
17
-
18
-
19
-
20
-
21
-
22
-
23
-
24
-
25
-
26
-
27
-
28
-
29
-
30
-
31
-
32
-
33
-
34
-
35
-
36
-
37
-
38
-
39
-
40
-
41
-
42
-
43
-
44
-
45
-
46
-
47
-
48
-
49
-
50
-
51
-
52
-
53
-
54
-
55
-
56
-
57
-
58
-
59
-
60
-
61
-
62
-
63
-
64
-
65
-
66
-
67
-
68
-
69
-
70
-
71
-
72
-
73
-
74
-
75
-
76
-
77
-
78
-
79
-
80
-
81
-
82
-
83
-
84
-
85
-
86
-
87
-
88
-
89
-
90
-
91
-
92
-
93
-
94
-
95
-
96
-
97
-
98
-
99
-
100
-
101
-
102
-
103
-
104
-
105
-
106
-
107
-
108
-
109
-
110
-
111
-
112
-
113
-
114
-
115
-
116
-
117
-
118
-
119
-
 120
120 -
 121
121 -
 122
122 -
 123
123 -
 124
124 -
 125
125 -
 126
126 -
 127
127 -
 128
128 -
 129
129 -
 130
130 -
 131
131 -
 132
132 -
 133
133 -
 134
134 -
 135
135 -
 136
136 -
 137
137 -
 138
138 -
 139
139 -
 140
140 -
141
-
142
-
143
-
144
-
145
-
146
-
147
-
148
-
149
-
150
-
151
-
152
-
153
-
154
-
155
-
156
-
157
-
158
-
159
-
160
-
161
-
162
-
163
-
164
-
165
-
166
-
167
-
168
-
169
-
170
-
171
-
172
-
173
-
174
-
175
-
176
-
177
-
178
-
179
-
180
-
181
-
182
-
183
-
184
-
185
-
186
-
187
-
188
-
189
-
190
-
191
-
192
-
193
-
194
-
195
-
196
-
197
-
198
-
199
-
200
-
201
-
202
-
203
-
204
-
205
-
206
-
207
-
208
-
209
-
210
-
211
-
212
-
213
-
214
-
215
-
216
-
217
-
218
-
219
-
220
-
221
-
222
-
223
-
224
-
225
-
226
-
227
-
228
-
229
-
230
-
231
-
232
-
233
-
234
-
235
-
236
-
237
-
238
-
239
-
240
-
241
-
242
-
243
-
244
 |
 |

2009 REGISTRATION DOCUMENT SCHNEIDER ELECTRIC128
CONSOLIDATED FINANCIAL STATEMENTS
5NOTES TO THE CONSOLIDATED FINANCIAL STATEMENTS
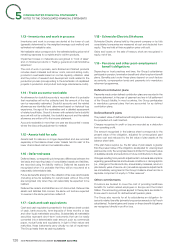
Commodity contracts
The Group also purchases commodity derivatives including forward
purchase contracts, swaps and options to hedge price risks on all
or part of its forecast future purchases. Under IAS39, these qualify
as cash fl ow hedges. The hedging instruments are recognised in
the balance sheet and are measured at fair value at the period-end.
The portion of the gain or loss on the hedging instrument that is
determined to be an effective hedge is accumulated in equity, under
“Other reserves”, and reclassifi ed into the income statement under
“Cost of sales” when the hedged transaction affects profi t or loss,
leading to an adjustment of gross profi t. The ineffective portion of
the gain or loss on the hedging instrument is recognised in “Other
fi nancial income and expense”.
Cash fl ows from derivative fi nancial instruments are recognised in the
statement of cash fl ows in a manner consistent with the underlying
transactions.
Put options granted to minority shareholders
Under IAS32 – Financial Instruments: Disclosure and Presentation
– commitments to buy out minority shareholders (e.g. put options)
must be recognised as a liability, in an amount corresponding to the
exercise price of the put options.
In the absence of established accounting practice, the difference
between the put options’ exercise price and the share in the
underlying net assets is posted to goodwill without remeasuring the
acquired assets and liabilities at fair value. Subsequent changes in
the fair value of the liability are recognised by adjusting goodwill.
1.24 - Revenue recognition
The Group’s revenues primarily include merchandise sales and
revenues from service and project contracts.
Merchandise sales
Revenue from sales is recognised when the product is shipped and
title transferred (standard shipping terms are FOB).
Discounts offered to distributors are accrued when the products are
sold to the distributor and recognised as a deduction from revenue.
Certain subsidiaries also offer cash discounts to distributors. These
discounts are deducted from sales.
Total revenue is presented net of these discounts and rebates.
Service contracts
Revenue from service contracts is recorded over the contractual
period of service. It is recognised when the result of the transaction
can be reliably determined, by the percentage of completion method.
Long-term contracts
Income from long-term contracts is recognised using the percentage-
of-completion method, based either on the percentage of costs
incurred in relation to total estimated costs of the entire contract, or
on the contract’s technical milestones, notably proof of installation
or delivery of equipment. When a contract includes performance
clauses in the Group’s favour , the related revenue is recognised at
each project milestone and a provision is set aside if targets are
not met.
Losses at completion for a given contract are provided for in full
as soon as they become probable. The cost of work-in-process
includes direct and indirect costs relating to the contracts.
1.25 - Earnings per share
Earnings per share are calculated in accordance with IAS33 –
Earnings Per Share.
Diluted earnings per share are calculated by adjusting profi t and
the weighted average number of shares outstanding for the dilutive
effect of the exercise of stock options outstanding at the balance
sheet date. The dilutive effect of stock options is determined by
applying the “treasury stock” method, which consists of taking into
account the number of shares that could be purchased, based on
the average share price for the year, using the proceeds from the
exercise of the rights attached to the options.
1.26 - Statement of cash flows
The consolidated statement of cash flows has been prepared
using the indirect method, which consists of reconciling net profi t
to net cash provided by operations. Net cash and cash equivalents
represent cash and cash equivalents as presented in the balance
sheet (see note1.17) net of bank overdrafts.