APC 2009 Annual Report Download - page 154
Download and view the complete annual report
Please find page 154 of the 2009 APC annual report below. You can navigate through the pages in the report by either clicking on the pages listed below, or by using the keyword search tool below to find specific information within the annual report.-
 1
1 -
2
-
3
-
4
-
5
-
6
-
7
-
8
-
9
-
10
-
11
-
12
-
13
-
14
-
15
-
16
-
17
-
18
-
19
-
20
-
21
-
22
-
23
-
24
-
25
-
26
-
27
-
28
-
29
-
30
-
31
-
32
-
33
-
34
-
35
-
36
-
37
-
38
-
39
-
40
-
41
-
42
-
43
-
44
-
45
-
46
-
47
-
48
-
49
-
50
-
51
-
52
-
53
-
54
-
55
-
56
-
57
-
58
-
59
-
60
-
61
-
62
-
63
-
64
-
65
-
66
-
67
-
68
-
69
-
70
-
71
-
72
-
73
-
74
-
75
-
76
-
77
-
78
-
79
-
80
-
81
-
82
-
83
-
84
-
85
-
86
-
87
-
88
-
89
-
90
-
91
-
92
-
93
-
94
-
95
-
96
-
97
-
98
-
99
-
100
-
101
-
102
-
103
-
104
-
105
-
106
-
107
-
108
-
109
-
110
-
111
-
112
-
113
-
114
-
115
-
116
-
117
-
118
-
119
-
120
-
121
-
122
-
123
-
124
-
125
-
126
-
127
-
128
-
129
-
130
-
131
-
132
-
133
-
134
-
135
-
136
-
137
-
138
-
139
-
140
-
141
-
142
-
143
-
 144
144 -
 145
145 -
 146
146 -
 147
147 -
 148
148 -
 149
149 -
 150
150 -
 151
151 -
 152
152 -
 153
153 -
 154
154 -
 155
155 -
 156
156 -
 157
157 -
 158
158 -
 159
159 -
 160
160 -
 161
161 -
 162
162 -
 163
163 -
 164
164 -
165
-
166
-
167
-
168
-
169
-
170
-
171
-
172
-
173
-
174
-
175
-
176
-
177
-
178
-
179
-
180
-
181
-
182
-
183
-
184
-
185
-
186
-
187
-
188
-
189
-
190
-
191
-
192
-
193
-
194
-
195
-
196
-
197
-
198
-
199
-
200
-
201
-
202
-
203
-
204
-
205
-
206
-
207
-
208
-
209
-
210
-
211
-
212
-
213
-
214
-
215
-
216
-
217
-
218
-
219
-
220
-
221
-
222
-
223
-
224
-
225
-
226
-
227
-
228
-
229
-
230
-
231
-
232
-
233
-
234
-
235
-
236
-
237
-
238
-
239
-
240
-
241
-
242
-
243
-
244
 |
 |

2009 REGISTRATION DOCUMENT SCHNEIDER ELECTRIC152
CONSOLIDATED FINANCIAL STATEMENTS
5NOTES TO THE CONSOLIDATED FINANCIAL STATEMENTS
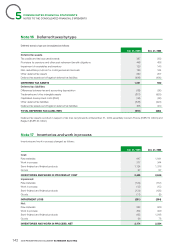
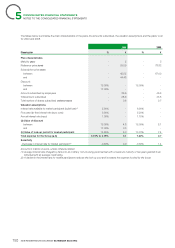
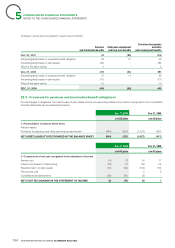
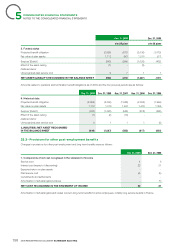
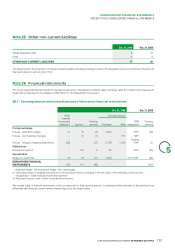
21.7 - Income tax related to components of Other Comprehensive Income
Total income tax recorded in Other Comprehensive Income amounts to EUR 197million as of December 31, 2009 and can be analysed as
follows:
Dec. 31, 2009 Dec. 31, 2008 Change in tax
Cash-fl ow hedges 72 96 (24)
Available-for-sale fi nancial assets (19) (11) (8)
Actuarial gains (losses) on defi ned benefi ts 145 143 2
Other (1) 6 (7)
TOTAL 197 234 (37)
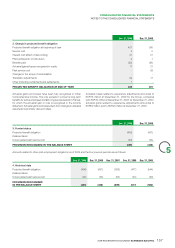
Note22
Pensions and other post-employment benefit obligations
The Group has set up various post-employment benefi t plans for
employees covering pensions, termination benefi ts, healthcare, life
insurance and other benefi ts, as well as long-term benefi t plans for
active employees, primarily in France.
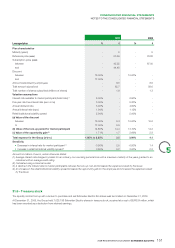
Actuarial valuations are generally performed each year. The
assumptions used vary according to the economic conditions
prevailing in the country concerned, as follows:
Weighted average rate Of which US plans
2009 2008 2009 2008
Discount rate 5.2% 5.4% 5.8% 5.8%
Rate of compensation increases 3.1% 3.9% 4.5% 4.5%
Expected return on plan assets (1) 7.1% 7.8% 8.3% 9.0%
(1)corresponding to the 2008 and 2009 rates.
The discount rate is determined on the basis of the interest rate
for investment-grade (AA) corporate bonds or, in the event a liquid
market does not exist, government bonds with a maturity that
matches the duration of the benefi t obligation (reference: Bloomberg).
In the United States, the average discount rate is determined on the
basis of a yield curve for investment-grade (AA and AAA) corporate
bonds. These benchmarks, which are the same as those used in
previous years, comply with IAS19.
The expected return on plan assets is determined on the basis of
the weighted average expected return of the total asset value. In the
United States, the expected return on plan assets for 2010 is 8.3%.
The discount rate currently stands at 4.6% in the euro zone, 5.8%
in the United States and 5.4% in the United Kingdom.
A 0.5 point increase in the discount rate would reduce pension and
termination benefi t obligations by around EUR 108million and the
service cost by EUR 1million. A 0.5 point decrease would increase
pension and termination benefi t obligations by EUR 116million and
the service cost by EUR 1million.
The post-employment healthcare obligation mainly concerns the
United States. A one point increase in healthcare costs rate would
increase the post-employment healthcare obligation by EUR 39million
and the sum of the service cost and interest cost by EUR 3million.
A one point decrease in healthcare costs rate would decrease the
post-employment healthcare obligation by EUR 34million and the
sum of the service cost and interest cost by EUR 2million.
In 2009, the rate of healthcare cost increases in the United States is
based on a decreasing trend from 9% in 2010 to 5% in 2014. This
compares with the previous year’s forecast of 9% in 2009 to 5% in
2013. The rate in France was estimated at 4.0% in 2009 and was
4.5% in 2008.
On December 31, 2009, the US defi ned benefi t plans were converted
into defi ned contribution plans. The resulting curtailment gain of
around EUR 92million was recognised in full in the income statement.
Pension and termination benefit obligations
Pension and termination benefi t obligations primarily concern the
Group’s North American and European subsidiaries. These plans
feature either a lump-sum payment on the employee’s retirement or
regular pension payments after retirement. The amount is based on
years of service, grade and end-of-career salary. They also include
top-hat payments granted to certain senior executives guaranteeing
supplementary retirement income beyond that provided by general,
mandatory pension schemes.
The majority of benefi t obligations under these plans, which represent
76% of the Group’s total commitment or EUR 1,571million at
December 31, 2009, are partially or fully funded through payments
to external funds. These funds are not invested in Group assets.