APC 2009 Annual Report Download - page 133
Download and view the complete annual report
Please find page 133 of the 2009 APC annual report below. You can navigate through the pages in the report by either clicking on the pages listed below, or by using the keyword search tool below to find specific information within the annual report.-
 1
1 -
2
-
3
-
4
-
5
-
6
-
7
-
8
-
9
-
10
-
11
-
12
-
13
-
14
-
15
-
16
-
17
-
18
-
19
-
20
-
21
-
22
-
23
-
24
-
25
-
26
-
27
-
28
-
29
-
30
-
31
-
32
-
33
-
34
-
35
-
36
-
37
-
38
-
39
-
40
-
41
-
42
-
43
-
44
-
45
-
46
-
47
-
48
-
49
-
50
-
51
-
52
-
53
-
54
-
55
-
56
-
57
-
58
-
59
-
60
-
61
-
62
-
63
-
64
-
65
-
66
-
67
-
68
-
69
-
70
-
71
-
72
-
73
-
74
-
75
-
76
-
77
-
78
-
79
-
80
-
81
-
82
-
83
-
84
-
85
-
86
-
87
-
88
-
89
-
90
-
91
-
92
-
93
-
94
-
95
-
96
-
97
-
98
-
99
-
100
-
101
-
102
-
103
-
104
-
105
-
106
-
107
-
108
-
109
-
110
-
111
-
112
-
113
-
114
-
115
-
116
-
117
-
118
-
119
-
120
-
121
-
122
-
 123
123 -
 124
124 -
 125
125 -
 126
126 -
 127
127 -
 128
128 -
 129
129 -
 130
130 -
 131
131 -
 132
132 -
 133
133 -
 134
134 -
 135
135 -
 136
136 -
 137
137 -
 138
138 -
 139
139 -
 140
140 -
 141
141 -
 142
142 -
 143
143 -
144
-
145
-
146
-
147
-
148
-
149
-
150
-
151
-
152
-
153
-
154
-
155
-
156
-
157
-
158
-
159
-
160
-
161
-
162
-
163
-
164
-
165
-
166
-
167
-
168
-
169
-
170
-
171
-
172
-
173
-
174
-
175
-
176
-
177
-
178
-
179
-
180
-
181
-
182
-
183
-
184
-
185
-
186
-
187
-
188
-
189
-
190
-
191
-
192
-
193
-
194
-
195
-
196
-
197
-
198
-
199
-
200
-
201
-
202
-
203
-
204
-
205
-
206
-
207
-
208
-
209
-
210
-
211
-
212
-
213
-
214
-
215
-
216
-
217
-
218
-
219
-
220
-
221
-
222
-
223
-
224
-
225
-
226
-
227
-
228
-
229
-
230
-
231
-
232
-
233
-
234
-
235
-
236
-
237
-
238
-
239
-
240
-
241
-
242
-
243
-
244
 |
 |

2009 REGISTRATION DOCUMENT SCHNEIDER ELECTRIC 131
CONSOLIDATED FINANCIAL STATEMENTS
5
NOTES TO THE CONSOLIDATED FINANCIAL STATEMENTS
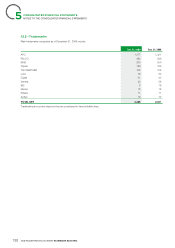
Electrical
Distribution Automation &
Control Critical Power Holding Total
Sales 9,175 4,252 2,366 - 15,793
EBITAR* 1,631 427 375 (297) 2,136
% 17.8% 10.0% 15.8% - 13.5%
EBITA* 1,490 308 346 (321) 1,823
% 16.2% 7.2% 14.6% - 11.5%
* including a non recurring gain on pension plan modifi cation:
75 17
Dec. 31, 2008
Europe North America Asia Pacifi c Rest of the world Holding Total
Sales 8,101 5,053 3,395 1,762 - 18,311
EBITAR 1,550 856 555 293 (317) 2,937
% 19.1% 16.9% 16.3% 16.6% - 16.0%
EBITA 1,423 821 539 291 (301) 2,773
% 17.6% 16.2% 15.9% 16.5% - 15.1%
Electrical
Distribution Automation &
Control Critical Power Holding Total
Sales 10,343 5,313 2,655 - 18,311
EBITAR 2,043 818 393 (317) 2,937
% 19.8% 15.4% 14.8% - 16.0%
EBITA 1,925 771 378 (301) 2,773
% 18.6% 14.5% 14.2% - 15.1%
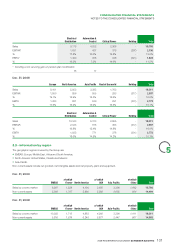
3.3 - Information by region
The geographic regions covered by the Group are:
•EMEAS: Europe, Middle East, Africa and South America;
•North America: United States, Canada and Mexico;
•Asia-Pacifi c.
Non-current assets include net goodwill, net intangible assets and net property, plant and equipment.
Dec. 31, 2009
EMEAS of which
France North America of which
USA Asia Pacifi c of which
China Total
Sales by country market 8,297 1,528 4,190 3,635 3,306 1,642 15,793
Non-current assets 5,939 1,707 5,860 5,592 2,695 934 14,494
Dec. 31, 2008
EMEAS of which
France North America of which
USA Asia-Pacifi c of which
China Total
Sales by country market 10,032 1,713 4,883 4,200 3,396 1,411 18,311
Non-current assets 5,816 1,679 6,240 5,877 2,447 967 14,503