BB&T 2014 Annual Report Download - page 107
Download and view the complete annual report
Please find page 107 of the 2014 BB&T annual report below. You can navigate through the pages in the report by either clicking on the pages listed below, or by using the keyword search tool below to find specific information within the annual report.-
 1
1 -
2
-
3
-
4
-
5
-
6
-
7
-
8
-
9
-
10
-
11
-
12
-
13
-
14
-
15
-
16
-
17
-
18
-
19
-
20
-
21
-
22
-
23
-
24
-
25
-
26
-
27
-
28
-
29
-
30
-
31
-
32
-
33
-
34
-
35
-
36
-
37
-
38
-
39
-
40
-
41
-
42
-
43
-
44
-
45
-
46
-
47
-
48
-
49
-
50
-
51
-
52
-
53
-
54
-
55
-
56
-
57
-
58
-
59
-
60
-
61
-
62
-
63
-
64
-
65
-
66
-
67
-
68
-
69
-
70
-
71
-
72
-
73
-
74
-
75
-
76
-
77
-
78
-
79
-
80
-
81
-
82
-
83
-
84
-
85
-
86
-
87
-
88
-
89
-
90
-
91
-
92
-
93
-
94
-
95
-
96
-
 97
97 -
 98
98 -
 99
99 -
 100
100 -
 101
101 -
 102
102 -
 103
103 -
 104
104 -
 105
105 -
 106
106 -
 107
107 -
 108
108 -
 109
109 -
 110
110 -
 111
111 -
 112
112 -
 113
113 -
 114
114 -
 115
115 -
 116
116 -
 117
117 -
118
-
119
-
120
-
121
-
122
-
123
-
124
-
125
-
126
-
127
-
128
-
129
-
130
-
131
-
132
-
133
-
134
-
135
-
136
-
137
-
138
-
139
-
140
-
141
-
142
-
143
-
144
-
145
-
146
-
147
-
148
-
149
-
150
-
151
-
152
-
153
-
154
-
155
-
156
-
157
-
158
-
159
-
160
-
161
-
162
-
163
-
164
 |
 |

Table of Contents
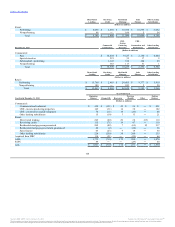
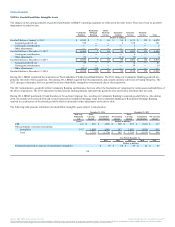
AFS securities:
MBS issued by GSE $ 10,259 $ 406 $ 1,935 $ 140 $ 12,194 $ 546
States and political subdivisions 232 8 441 83 673 91
Securities acquired from FDIC 34 1 ― ― 34 1
Total $ 10,525 $ 415 $ 2,376 $ 223 $ 12,901 $ 638
HTM securities:
U.S. Treasury $ 384 $ 8 $ ― $ ― $ 384 $ 8
GSE 4,996 397 ― ― 4,996 397
MBS issued by GSE 8,800 219 48 1 8,848 220
Total $ 14,180 $ 624 $ 48 $ 1 $ 14,228 $ 625
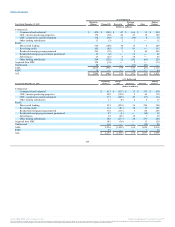
Periodic reviews are conducted to identify and evaluate each investment with an unrealized loss for OTTI. An unrealized loss exists when the current fair
value of an individual security is less than its amortized cost basis. Unrealized losses that are determined to be temporary in nature are recorded, net of tax, in
AOCI for AFS securities. The unrealized losses on GSE securities and MBS issued by GSE were the result of increases in market interest rates compared to the
date the securities were acquired rather than the credit quality of the issuers.
Cash flow modeling is used to evaluate non-agency MBS in an unrealized loss position for potential credit impairment. These models give consideration to
long-term macroeconomic factors applied to current security default rates, prepayment rates and recovery rates and security-level performance. At December
31, 2014, one non-agency MBS had an immaterial amount of other than temporary credit impairment.
At December 31, 2014, $55 million of the unrealized loss on municipal securities was the result of fair value hedge basis adjustments that are a component of
amortized cost. Municipal securities in an unrealized loss position are evaluated for credit impairment through a qualitative analysis of issuer performance
and the primary source of repayment. At December 31, 2014, the evaluation of municipal securities indicated one municipal security had an immaterial
amount of other than temporary credit impairment.
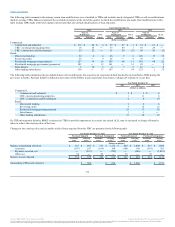
During the first quarter of 2014, approximately $8.3 billion of nonguaranteed, closed-end, first and second lien position residential mortgage loans, along
with the related allowance, were transferred from direct retail lending to residential mortgage to facilitate compliance with a series of new rules related to
mortgage servicing associated with first and second lien position mortgages collateralized by real estate.
During the first quarter of 2014, the CRE loan categories were realigned into CRE – income producing properties and CRE – construction and development
in order to better reflect the nature of the underlying loans. Prior period data has been reclassified to conform to this new presentation.
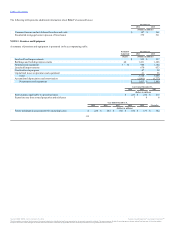
During the third quarter of 2014, approximately $550 million of loans, which were primarily performing residential mortgage TDRs, with a related ALLL of
$57 million were sold for a gain of $42 million. During the fourth quarter of 2014, approximately $140 million of loans, which were primarily residential
mortgage NPLs, with a related ALLL of $19 million were sold for a gain of $24 million. Both gains were recognized as reductions to the provision for credit
losses.
Effective October 1, 2014, loans subject to the commercial loss sharing agreement with the FDIC related to the Colonial acquisition were no longer covered
by loss sharing. At December 31, 2014, these loans had a carrying value of $561 million, a UPB of $836 million and an allowance of $38 million and are
included in acquired from FDIC loans. Loans totaling $654 million at December 31, 2014 continue to be covered by loss sharing and are included in the
acquired from FDIC balance.
During 2013, BB&T sold a consumer lending subsidiary with approximately $500 million in loans and $27 million of related ALLL. In addition,
approximately $230 million of loans, with $38 million of related ALLL, was transferred from retail other lending subsidiaries to residential mortgage and $47
million of unallocated ALLL was allocated to the loan portfolio segments.
106
Source: BB&T CORP, 10-K, February 25, 2015 Powered by Morningstar® Document Research℠
The information contained herein may not be copied, adapted or distributed and is not warranted to be accurate, complete or timely. The user assumes all risks for any damages or losses arising from any use of this information,
except to the extent such damages or losses cannot be limited or excluded by applicable law. Past financial performance is no guarantee of future results.