BB&T 2014 Annual Report Download - page 57
Download and view the complete annual report
Please find page 57 of the 2014 BB&T annual report below. You can navigate through the pages in the report by either clicking on the pages listed below, or by using the keyword search tool below to find specific information within the annual report.-
 1
1 -
2
-
3
-
4
-
5
-
6
-
7
-
8
-
9
-
10
-
11
-
12
-
13
-
14
-
15
-
16
-
17
-
18
-
19
-
20
-
21
-
22
-
23
-
24
-
25
-
26
-
27
-
28
-
29
-
30
-
31
-
32
-
33
-
34
-
35
-
36
-
37
-
38
-
39
-
40
-
41
-
42
-
43
-
44
-
45
-
46
-
 47
47 -
 48
48 -
 49
49 -
 50
50 -
 51
51 -
 52
52 -
 53
53 -
 54
54 -
 55
55 -
 56
56 -
 57
57 -
 58
58 -
 59
59 -
 60
60 -
 61
61 -
 62
62 -
 63
63 -
 64
64 -
 65
65 -
 66
66 -
 67
67 -
68
-
69
-
70
-
71
-
72
-
73
-
74
-
75
-
76
-
77
-
78
-
79
-
80
-
81
-
82
-
83
-
84
-
85
-
86
-
87
-
88
-
89
-
90
-
91
-
92
-
93
-
94
-
95
-
96
-
97
-
98
-
99
-
100
-
101
-
102
-
103
-
104
-
105
-
106
-
107
-
108
-
109
-
110
-
111
-
112
-
113
-
114
-
115
-
116
-
117
-
118
-
119
-
120
-
121
-
122
-
123
-
124
-
125
-
126
-
127
-
128
-
129
-
130
-
131
-
132
-
133
-
134
-
135
-
136
-
137
-
138
-
139
-
140
-
141
-
142
-
143
-
144
-
145
-
146
-
147
-
148
-
149
-
150
-
151
-
152
-
153
-
154
-
155
-
156
-
157
-
158
-
159
-
160
-
161
-
162
-
163
-
164
 |
 |

Table of Contents
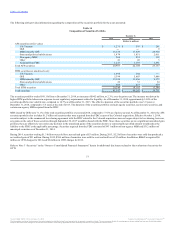
Commercial, financial and agricultural $ 27,615 $ 25,260 $ 23,863 $ 21,452 $ 20,490
Lease receivables 1,120 1,126 1,114 1,067 1,158
Real estate-construction and land development 4,736 4,630 5,900 7,714 10,969
Real estate-mortgage 63,464 65,485 65,760 60,821 57,418
Consumer 22,949 19,416 17,966 16,415 13,532
Total loans and leases held for investment 119,884 115,917 114,603 107,469 103,567
LHFS 1,423 1,222 3,761 3,736 3,697
Total loans and leases $ 121,307 $ 117,139 $ 118,364 $ 111,205 $ 107,264
Fixed Rate:
1 year or less (1) $ 2,644 $ 399 $ 3,043
1-5 years 3,322 379 3,701
After 5 years 4,350 729 5,079
Total 10,316 1,507 11,823
Variable Rate:
1 year or less (1) 4,101 877 4,978
1-5 years 10,338 1,760 12,098
After 5 years 2,860 592 3,452
Total 17,299 3,229 20,528
Total loans and leases (2) $ 27,615 $ 4,736 $ 32,351
(1) Includes loans due on demand.
(2) The above table excludes:
(i) consumer $ 22,949
(ii) real estate mortgage 63,464
(iii) LHFS 1,423
(iv) lease receivables 1,120
Total $ 88,956
Asset Quality
The following discussion includes assets acquired from the FDIC. Loans acquired from the FDIC, which are considered performing due to the application of
the expected cash flows method, were $1.2 billion at December 31, 2014 and $2.0 billion in the prior year. Refer to “Acquired from FDIC and FDIC Loss
Share Receivable/Payable” in “Management’s Discussion and Analysis of Financial Condition and Results of Operations” herein for additional information.
Foreclosed real estate acquired from the FDIC totaled $56 million and $121 million at December 31, 2014 and 2013, respectively.
NPAs, which include foreclosed real estate, repossessions and NPLs, totaled $782 million at December 31, 2014 compared to $1.2 billion at December 31,
2013. The decline in NPAs of $392 million was driven by decreases of $319 million in NPLs and $73 million in foreclosed property. Commercial and
industrial NPLs were down $124 million due to continued improvement in credit quality. Residential mortgage NPLs declined $77 million due to the fourth
quarter sale of $121 million of residential mortgage NPLs, partially offset by the first quarter loan transfer from direct retail lending to residential mortgage,
which included $55 million of NPLs.
56
Source: BB&T CORP, 10-K, February 25, 2015 Powered by Morningstar® Document Research℠
The information contained herein may not be copied, adapted or distributed and is not warranted to be accurate, complete or timely. The user assumes all risks for any damages or losses arising from any use of this information,
except to the extent such damages or losses cannot be limited or excluded by applicable law. Past financial performance is no guarantee of future results.