BB&T 2014 Annual Report Download - page 36
Download and view the complete annual report
Please find page 36 of the 2014 BB&T annual report below. You can navigate through the pages in the report by either clicking on the pages listed below, or by using the keyword search tool below to find specific information within the annual report.-
 1
1 -
2
-
3
-
4
-
5
-
6
-
7
-
8
-
9
-
10
-
11
-
12
-
13
-
14
-
15
-
16
-
17
-
18
-
19
-
20
-
21
-
22
-
23
-
24
-
25
-
 26
26 -
 27
27 -
 28
28 -
 29
29 -
 30
30 -
 31
31 -
 32
32 -
 33
33 -
 34
34 -
 35
35 -
 36
36 -
 37
37 -
 38
38 -
 39
39 -
 40
40 -
 41
41 -
 42
42 -
 43
43 -
 44
44 -
 45
45 -
 46
46 -
47
-
48
-
49
-
50
-
51
-
52
-
53
-
54
-
55
-
56
-
57
-
58
-
59
-
60
-
61
-
62
-
63
-
64
-
65
-
66
-
67
-
68
-
69
-
70
-
71
-
72
-
73
-
74
-
75
-
76
-
77
-
78
-
79
-
80
-
81
-
82
-
83
-
84
-
85
-
86
-
87
-
88
-
89
-
90
-
91
-
92
-
93
-
94
-
95
-
96
-
97
-
98
-
99
-
100
-
101
-
102
-
103
-
104
-
105
-
106
-
107
-
108
-
109
-
110
-
111
-
112
-
113
-
114
-
115
-
116
-
117
-
118
-
119
-
120
-
121
-
122
-
123
-
124
-
125
-
126
-
127
-
128
-
129
-
130
-
131
-
132
-
133
-
134
-
135
-
136
-
137
-
138
-
139
-
140
-
141
-
142
-
143
-
144
-
145
-
146
-
147
-
148
-
149
-
150
-
151
-
152
-
153
-
154
-
155
-
156
-
157
-
158
-
159
-
160
-
161
-
162
-
163
-
164
 |
 |

Table of Contents
Total deposits at December 31, 2014 were $129.0 billion, an increase of $1.6 billion, or 1.2%, from the prior year. The increase in deposits reflects strong
growth in noninterest-bearing deposits, which were up $3.8 billion or 10.9% compared to the prior year. Interest checking and money market and savings
grew $1.4 billion and $2.0 billion, respectively, while time deposits and IRAs declined $5.7 billion. The increase in total deposits also reflects the previously
mentioned acquisition of 21 branches in Texas during the second quarter. The average cost of interest-bearing deposits for 2014 was 0.26%, a decline of six
basis points compared to the prior year.
Total shareholders’ equity increased $1.6 billion, or 7.1%, compared to the prior year. This increase was primarily driven by net income in excess of
dividends totaling $1.4 billion. BB&T’s Tier 1 risk-based capital and total risk-based capital ratios at December 31, 2014 increased to 12.4% and 14.9%,
respectively, compared to 11.8% and 14.3% at December 31, 2013, respectively. BB&T’s risk-based capital ratios remain well above regulatory standards for
well-capitalized banks. BB&T’s Basel III common equity tier 1 ratio, which is based on management’s interpretation of the FRB rules that became effective
on January 1, 2015, was 10.3% at December 31, 2014, versus 9.7% at December 31, 2013.
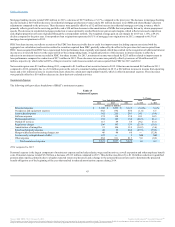
Net Interest Income and NIM
Net interest income is BB&T’s primary source of revenue. Net interest income is influenced by a number of factors, including the volume, mix and maturity
of interest-earning assets and interest-bearing liabilities and the interest rates earned and paid thereon. The difference between rates earned on interest-earning
assets and the cost of funds (with a FTE adjustment made to tax-exempt items to provide comparability with taxable items) is measured by the NIM.
2014 compared to 2013
For 2014, net interest income on a FTE basis totaled $5.5 billion, a decrease of $245 million or 4.3% compared to the prior year. The decrease in net interest
income reflects lower yields on new loans and securities and runoff in the loan portfolio acquired from the FDIC, partially offset by lower funding costs,
which declined $123 million compared to 2013. The improvement in funding costs reflects a six basis point reduction in the average cost of interest-bearing
deposits due to improved mix and a 67 basis point reduction in the average cost of long-term debt primarily due to the early extinguishment of $1.1 billion
of higher-cost FHLB advances during the third quarter and lower rates on new issuances.
The FTE-adjusted NIM is the primary measure used in evaluating the gross profit margin from the portfolios of earning assets. The FTE-adjusted NIM was
3.42% in 2014 compared with 3.68% in 2013. The decline in the NIM reflects lower yields on loans and securities, partially offset by the lower funding costs
described above. The average annualized FTE yield for total loans and leases was 4.42% for 2014, compared to 4.85% for the prior year. The decrease was
primarily due to lower yields on new loan originations and the runoff of higher yielding loans acquired from the FDIC. The FTE yield on the total securities
portfolio was 2.45% for the year ended December 31, 2014, compared to 2.51% for the prior year.
The average rate paid on interest-bearing deposits for 2014 dropped to 0.26%, from 0.32% in 2013. This improvement was driven by an 18 basis point
reduction in the cost of time deposits and IRAs.
The rates paid on average short-term borrowings declined to 0.13% in 2014 from 0.16% in 2013. At December 31, 2014, the targeted Federal funds rate was a
range of zero percent to 0.25%. The average rate on long-term debt during 2014 was 2.36%, compared to 3.03% for the prior year. This decline reflects the
previously mentioned early extinguishment of $1.1 billion of higher-cost FHLB advances and lower rates on new issuances.
2013 compared to 2012
For 2013, net interest income on an FTE-adjusted basis totaled $5.8 billion, a decrease of $244 million or 4.1%, compared to the prior year. The decrease in
net interest income reflects lower yields on new loans and securities and runoff in the loan portfolio acquired from the FDIC, partially offset by lower funding
costs, which declined $170 million compared to 2012. The improvement in funding costs reflects an 11 basis point reduction in the average cost of interest-
bearing deposits and a lower average long-term debt balance.
35
Source: BB&T CORP, 10-K, February 25, 2015 Powered by Morningstar® Document Research℠
The information contained herein may not be copied, adapted or distributed and is not warranted to be accurate, complete or timely. The user assumes all risks for any damages or losses arising from any use of this information,
except to the extent such damages or losses cannot be limited or excluded by applicable law. Past financial performance is no guarantee of future results.