BB&T 2014 Annual Report Download - page 43
Download and view the complete annual report
Please find page 43 of the 2014 BB&T annual report below. You can navigate through the pages in the report by either clicking on the pages listed below, or by using the keyword search tool below to find specific information within the annual report.-
 1
1 -
2
-
3
-
4
-
5
-
6
-
7
-
8
-
9
-
10
-
11
-
12
-
13
-
14
-
15
-
16
-
17
-
18
-
19
-
20
-
21
-
22
-
23
-
24
-
25
-
26
-
27
-
28
-
29
-
30
-
31
-
32
-
 33
33 -
 34
34 -
 35
35 -
 36
36 -
 37
37 -
 38
38 -
 39
39 -
 40
40 -
 41
41 -
 42
42 -
 43
43 -
 44
44 -
 45
45 -
 46
46 -
 47
47 -
 48
48 -
 49
49 -
 50
50 -
 51
51 -
 52
52 -
 53
53 -
54
-
55
-
56
-
57
-
58
-
59
-
60
-
61
-
62
-
63
-
64
-
65
-
66
-
67
-
68
-
69
-
70
-
71
-
72
-
73
-
74
-
75
-
76
-
77
-
78
-
79
-
80
-
81
-
82
-
83
-
84
-
85
-
86
-
87
-
88
-
89
-
90
-
91
-
92
-
93
-
94
-
95
-
96
-
97
-
98
-
99
-
100
-
101
-
102
-
103
-
104
-
105
-
106
-
107
-
108
-
109
-
110
-
111
-
112
-
113
-
114
-
115
-
116
-
117
-
118
-
119
-
120
-
121
-
122
-
123
-
124
-
125
-
126
-
127
-
128
-
129
-
130
-
131
-
132
-
133
-
134
-
135
-
136
-
137
-
138
-
139
-
140
-
141
-
142
-
143
-
144
-
145
-
146
-
147
-
148
-
149
-
150
-
151
-
152
-
153
-
154
-
155
-
156
-
157
-
158
-
159
-
160
-
161
-
162
-
163
-
164
 |
 |

Table of Contents
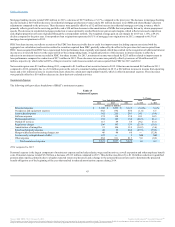
2014 compared to 2013
Noninterest income was $3.8 billion for 2014, a decline of 3.9% compared to 2013. This decrease was driven by declines in mortgage banking income, FDIC
loss share income, net securities gains and other income, partially offset by growth in insurance income.
Income from BB&T’s insurance agency/brokerage operations was the largest source of noninterest income in 2014. Insurance income was a record $1.6
billion, up $126 million compared to 2013, as increased volume and improving market conditions drove broad-based increases across the insurance business.
This growth was led by a $95 million increase in property and casualty commissions and a $17 million increase in contingent insurance commissions.
Mortgage banking income totaled $395 million in 2014, a decrease of $170 million, or 30.1%, compared to the prior year. The decrease in mortgage banking
income includes a $182 million decrease in residential mortgage production revenues primarily due to decreases in the volume and margins on loan sales,
which have come under pressure due to increased competition and sustained low interest rates. The decline also reflects an $18 million reduction in fees
primarily due to a reduction in volume. These declines were partially offset by increased servicing income due to a larger servicing portfolio as well as an
increase in derivative income.
Net securities gains declined $54 million as the prior year contained a $46 million gain on the sale of GNMA securities. FDIC loss share income, net, was $50
million worse than 2013, primarily due to a $29 million change in the offset to the provision for covered loans, which was a benefit in 2014 due to improved
credit quality on the acquired loans.
Trust and investment advisory revenues increased $21 million to a record $221 million, primarily the result of higher investment advisory revenues during
the current year. Other income decreased $60 million in 2014 compared to 2013, primarily due to a $31 million gain on the sale of a consumer lending
subsidiary in 2013, a $24 million decrease in income from assets related to certain post-employment benefits, which is offset in personnel expense, and an $8
million decrease in letter of credit fees. These declines and other smaller declines were partially offset by an increase of $19 million related to affordable
housing investments, primarily due to decreased impairment, and a $19 million increase in leasing income.
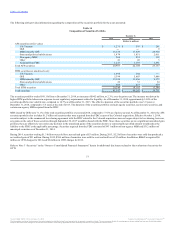
2013 compared to 2012
Noninterest income was $3.9 billion for 2013, up 3.1% compared to 2012. This increase was driven by strong results from BB&T’s insurance, investment
banking and brokerage, bankcard fees and merchant discounts, and trust and investment advisory LOBs, along with strong growth in checkcard fees and
steady growth in service charges on deposits. This growth in noninterest income was negatively impacted by a decrease in mortgage banking income.
Income from the insurance agency/brokerage operations was the largest source of noninterest income in 2013. Insurance income was up 11.6% compared to
2012, with approximately one-half of the growth attributable to the acquisition of Crump Insurance during April 2012, and the remainder primarily the result
of an improving market for insurance premiums and a $13 million experience-based refund of reinsurance premiums that was received in the second quarter
of 2013.
Investment banking and brokerage fees and commissions increased $18 million, or 4.9%, compared to 2012. This increase was largely driven by higher
investment commission income and increased investment banking activities. Bankcard fees and merchant discounts increased $20 million, or 8.5%, in 2013,
based on higher retail and commercial bankcard transaction volumes and an increase in merchant discount income. Trust and investment advisory revenues
increased $16 million, primarily the result of higher investment advisory revenues during the current year. Checkcard fees were $14 million higher than the
prior year, an increase of 7.6%, reflecting increased transaction volume, a portion of which is attributable to the acquisition of BankAtlantic in the prior year.
Service charges totaled $584 million, an increase of $18 million, or 3.2%, compared to 2012, reflecting growth in cash management products, an increase in
other deposit fees and the impact of the BankAtlantic acquisition.
42
Source: BB&T CORP, 10-K, February 25, 2015 Powered by Morningstar® Document Research℠
The information contained herein may not be copied, adapted or distributed and is not warranted to be accurate, complete or timely. The user assumes all risks for any damages or losses arising from any use of this information,
except to the extent such damages or losses cannot be limited or excluded by applicable law. Past financial performance is no guarantee of future results.