BB&T 2014 Annual Report Download - page 82
Download and view the complete annual report
Please find page 82 of the 2014 BB&T annual report below. You can navigate through the pages in the report by either clicking on the pages listed below, or by using the keyword search tool below to find specific information within the annual report.-
 1
1 -
2
-
3
-
4
-
5
-
6
-
7
-
8
-
9
-
10
-
11
-
12
-
13
-
14
-
15
-
16
-
17
-
18
-
19
-
20
-
21
-
22
-
23
-
24
-
25
-
26
-
27
-
28
-
29
-
30
-
31
-
32
-
33
-
34
-
35
-
36
-
37
-
38
-
39
-
40
-
41
-
42
-
43
-
44
-
45
-
46
-
47
-
48
-
49
-
50
-
51
-
52
-
53
-
54
-
55
-
56
-
57
-
58
-
59
-
60
-
61
-
62
-
63
-
64
-
65
-
66
-
67
-
68
-
69
-
70
-
71
-
 72
72 -
 73
73 -
 74
74 -
 75
75 -
 76
76 -
 77
77 -
 78
78 -
 79
79 -
 80
80 -
 81
81 -
 82
82 -
 83
83 -
 84
84 -
 85
85 -
 86
86 -
 87
87 -
 88
88 -
 89
89 -
 90
90 -
 91
91 -
 92
92 -
93
-
94
-
95
-
96
-
97
-
98
-
99
-
100
-
101
-
102
-
103
-
104
-
105
-
106
-
107
-
108
-
109
-
110
-
111
-
112
-
113
-
114
-
115
-
116
-
117
-
118
-
119
-
120
-
121
-
122
-
123
-
124
-
125
-
126
-
127
-
128
-
129
-
130
-
131
-
132
-
133
-
134
-
135
-
136
-
137
-
138
-
139
-
140
-
141
-
142
-
143
-
144
-
145
-
146
-
147
-
148
-
149
-
150
-
151
-
152
-
153
-
154
-
155
-
156
-
157
-
158
-
159
-
160
-
161
-
162
-
163
-
164
 |
 |

Table of Contents
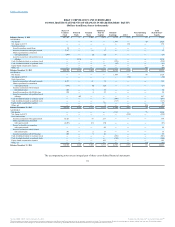
Consolidated Summary of Operations:
Interest income $ 1,518 $ 1,541 $ 1,537 $ 1,546 $ 1,566 $ 1,639 $ 1,643 $ 1,659
Interest expense 183 192 194 199 204 222 228 237
Provision for credit losses 83 34 74 60 60 92 168 272
Securities gains (losses), net ― (5) ― 2 5 - 23 23
Other noninterest income 1,004 941 933 909 980 905 1,023 978
Noninterest expense 1,411 1,556 1,551 1,403 1,456 1,471 1,496 1,414
Provision for income taxes (1) 236 134 173 217 243 450 221 481
Net income (1) 609 561 478 578 588 309 576 256
Noncontrolling interest 15 4 16 40 14 4 16 16
Preferred stock dividends 37 37 37 37 37 37 13 30
Net income available to common
shareholders (1) $ 557 $ 520 $ 425 $ 501 $ 537 $ 268 $ 547 $ 210
Basic EPS (1) $ 0.77 $ 0.72 $ 0.59 $ 0.70 $ 0.76 $ 0.38 $ 0.78 $ 0.30
Diluted EPS (1) $ 0.76 $ 0.71 $ 0.58 $ 0.69 $ 0.75 $ 0.37 $ 0.77 $ 0.29
Selected Average Balances:
Assets $ 186,441 $ 186,309 $ 185,065 $ 182,397 $ 179,534 $ 181,021 $ 182,508 $ 182,013
Securities, at amortized cost 40,817 40,566 40,656 40,117 37,022 36,547 36,719 36,801
Loans and leases (2) 119,912 120,471 118,510 116,372 117,001 118,265 117,852 116,981
Total earning assets 162,559 162,879 161,143 158,364 156,045 156,985 157,197 156,620
Deposits 130,315 130,608 129,599 125,718 125,906 127,948 129,983 130,437
Short-term borrowings 3,095 3,321 2,962 4,321 3,865 4,637 5,118 4,217
Long-term debt 22,139 22,069 22,206 22,432 20,756 19,447 18,287 18,690
Total interest-bearing liabilities 116,419 117,895 118,133 117,079 115,180 117,788 119,802 120,826
Shareholders' equity 24,619 24,187 23,876 23,264 22,305 22,139 21,789 21,315
(1) Results for the first and third quarters of 2013 include tax adjustments of $281 million and $235 million, respectively.
(2) Loans and leases are net of unearned income and include LHFS.
Fourth Quarter Results
Consolidated net income available to common shareholders for the fourth quarter of 2014 totaling $557 million was up 3.7% compared to $537 million
earned during the same period in 2013. On a diluted per common share basis, earnings for the fourth quarter of 2014 were $0.76, up 1.3% compared to $0.75
for the same period in 2013. BB&T’s results of operations for the fourth quarter of 2014 produced an annualized return on average assets of 1.30% and an
annualized return on average common shareholders’ equity of 10.08%, compared to prior year ratios of 1.30% and 10.85%, respectively.
Total revenues on a FTE basis were $2.4 billion for the fourth quarter of 2014, essentially flat compared to the earlier quarter as a decrease in taxable-
equivalent net interest income of $26 million was largely offset by a $19 million increase in noninterest income.
Net interest margin was 3.36%, down 20 basis points compared to the earlier quarter. Average earning assets increased $6.5 billion, or 4.2%, while average
interest-bearing liabilities increased $1.2 billion, or 1.1%. The annualized yield on the total loan portfolio for the fourth quarter was 4.29%, a decrease of 34
basis points compared to the earlier quarter, which primarily reflects lower yields on new loans and continued runoff of higher yielding loans acquired from
the FDIC. The annualized FTE yield on the average securities portfolio for the fourth quarter was 2.45%, which was seven basis points lower than the earlier
period.
81
Source: BB&T CORP, 10-K, February 25, 2015 Powered by Morningstar® Document Research℠
The information contained herein may not be copied, adapted or distributed and is not warranted to be accurate, complete or timely. The user assumes all risks for any damages or losses arising from any use of this information,
except to the extent such damages or losses cannot be limited or excluded by applicable law. Past financial performance is no guarantee of future results.