BB&T 2014 Annual Report Download - page 64
Download and view the complete annual report
Please find page 64 of the 2014 BB&T annual report below. You can navigate through the pages in the report by either clicking on the pages listed below, or by using the keyword search tool below to find specific information within the annual report.-
 1
1 -
2
-
3
-
4
-
5
-
6
-
7
-
8
-
9
-
10
-
11
-
12
-
13
-
14
-
15
-
16
-
17
-
18
-
19
-
20
-
21
-
22
-
23
-
24
-
25
-
26
-
27
-
28
-
29
-
30
-
31
-
32
-
33
-
34
-
35
-
36
-
37
-
38
-
39
-
40
-
41
-
42
-
43
-
44
-
45
-
46
-
47
-
48
-
49
-
50
-
51
-
52
-
53
-
 54
54 -
 55
55 -
 56
56 -
 57
57 -
 58
58 -
 59
59 -
 60
60 -
 61
61 -
 62
62 -
 63
63 -
 64
64 -
 65
65 -
 66
66 -
 67
67 -
 68
68 -
 69
69 -
 70
70 -
 71
71 -
 72
72 -
 73
73 -
 74
74 -
75
-
76
-
77
-
78
-
79
-
80
-
81
-
82
-
83
-
84
-
85
-
86
-
87
-
88
-
89
-
90
-
91
-
92
-
93
-
94
-
95
-
96
-
97
-
98
-
99
-
100
-
101
-
102
-
103
-
104
-
105
-
106
-
107
-
108
-
109
-
110
-
111
-
112
-
113
-
114
-
115
-
116
-
117
-
118
-
119
-
120
-
121
-
122
-
123
-
124
-
125
-
126
-
127
-
128
-
129
-
130
-
131
-
132
-
133
-
134
-
135
-
136
-
137
-
138
-
139
-
140
-
141
-
142
-
143
-
144
-
145
-
146
-
147
-
148
-
149
-
150
-
151
-
152
-
153
-
154
-
155
-
156
-
157
-
158
-
159
-
160
-
161
-
162
-
163
-
164
 |
 |
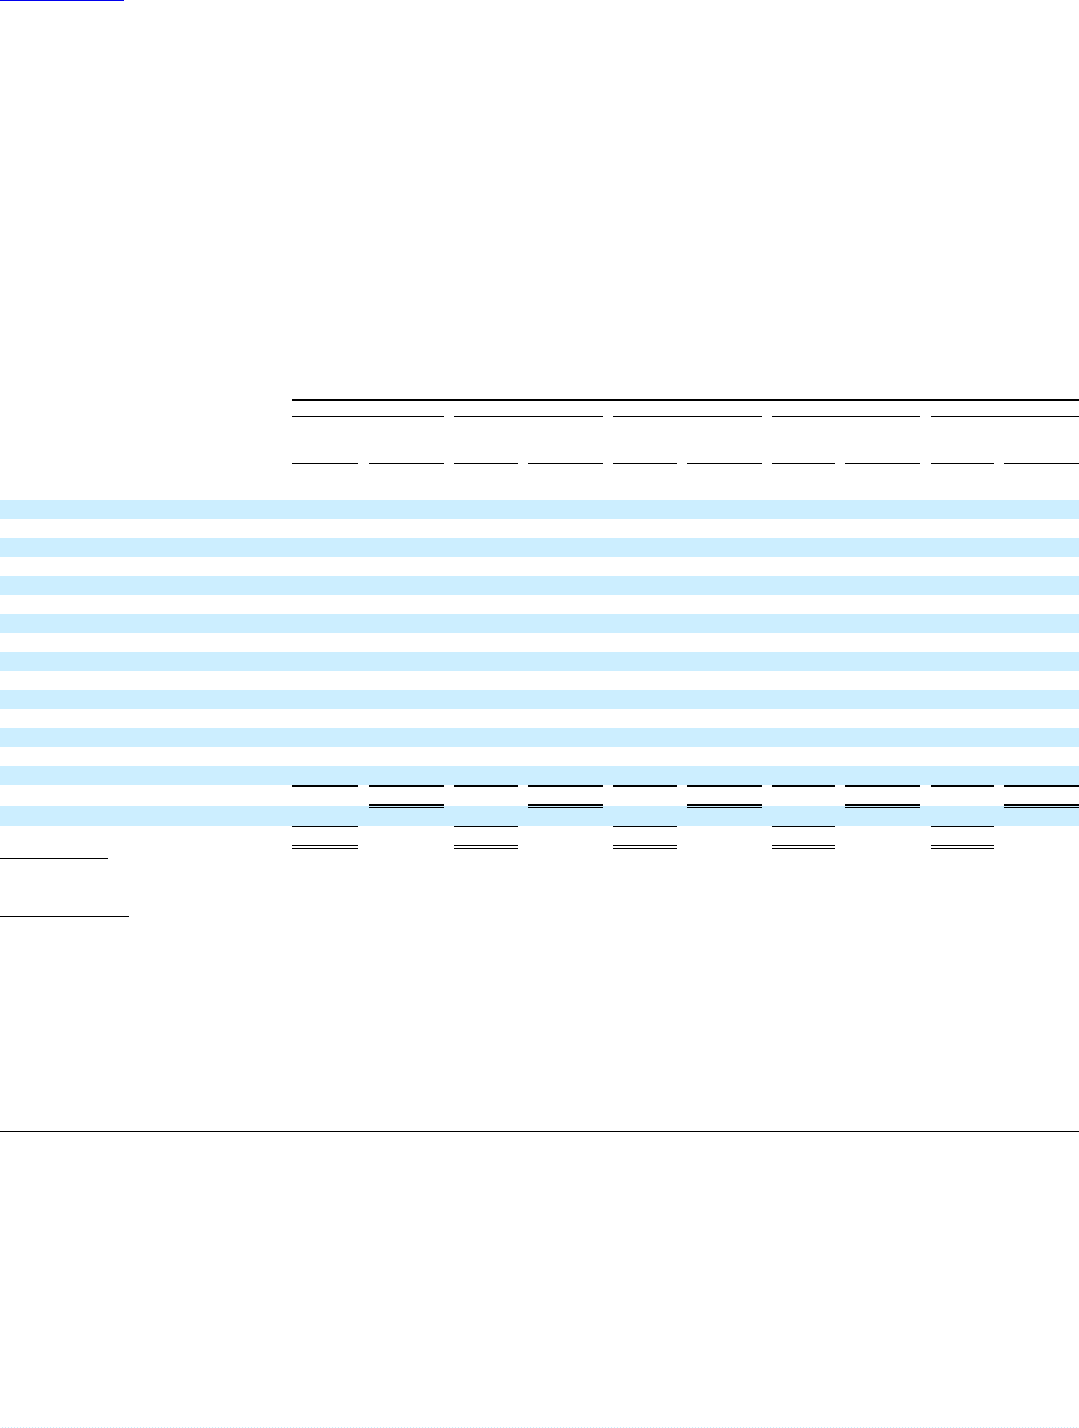
Table of Contents
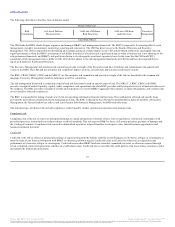
The ACL, which totaled $1.5 billion and $1.8 billion at December 31, 2014 and 2013, respectively, consists of the ALLL, which is presented separately on
the Consolidated Balance Sheets, and the RUFC, which is included in other liabilities on the Consolidated Balance Sheets. The ALLL amounted to 1.23% of
loans and leases held for investment at December 31, 2014, compared to 1.49% at December 31, 2013. The decline in the ALLL reflects continued
improvement in credit quality in most loan portfolios. The ratio of the ALLL to NPLs held for investment was 2.39x at December 31, 2014 compared to 1.85x
at December 31, 2013.
Net charge-offs totaled $538 million for 2014, compared to $792 million in 2013. Net charge-offs as a percentage of average loans and leases were 0.46% for
2014, compared to 0.69% in 2013. Net charge-offs declined in most loan portfolios, including decreases in the commercial and industrial and direct retail
lending portfolios of 55.7%% and 63.6%, respectively. CRE – construction and development had net recoveries of $8 million for the year.
Refer to Note 4 “Loans and ACL” in the “Notes to Consolidated Financial Statements” for additional disclosures.
The following table presents an estimated allocation of the ALLL at the end of each of the last five years. This allocation of the ALLL is calculated on an
approximate basis and is not necessarily indicative of future losses or allocations. The entire amount of the allowance is available to absorb losses occurring
in any category of loans and leases. During 2013, the balance in the unallocated ALLL was incorporated into the loan portfolio segments.
Balances at end of period applicable to:
Commercial and industrial $ 422 34.6 % $ 454 33.2 % $ 470 33.4 % $ 433 33.9 % $ 620 32.7 %
CRE - income producing
properties 162 8.9 149 8.8 170 8.6 249 8.2 315 8.8
CRE - construction and
development 48 2.3 76 2.1 134 2.5 371 3.6 601 5.6
Direct retail lending (1) 110 6.8 209 13.7 300 13.8 232 13.5 246 13.3
Sales finance 50 8.8 45 8.1 29 6.8 38 6.9 47 6.8
Revolving credit 110 2.1 115 2.1 102 2.0 112 2.1 109 2.1
Residential mortgage-
nonguaranteed (1) 217 25.1 269 20.3 296 20.3 318 18.7 280 16.6
Residential mortgage-
government guaranteed 36 0.8 62 1.0 32 0.9 47 0.5 18 0.4
Other lending subsidiaries 255 9.6 239 9.0 277 8.8 197 8.1 198 7.7
Acquired from FDIC 64 1.0 114 1.7 128 2.9 149 4.5 144 6.0
Unallocated ― ― ― ― 80 ― 110 ― 130 ―
Total ALLL 1,474 100.0 % 1,732 100.0 % 2,018 100.0 % 2,256 100.0 % 2,708 100.0 %
RUFC 60 89 30 29 47
Total ACL $ 1,534 $ 1,821 $ 2,048 $ 2,285 $ 2,755
(1) During the first quarter of 2014, $8.3 billion in loans were transferred from direct retail lending to residential mortgage.
Funding Activities
Deposits are the primary source of funds for lending and investing activities. Scheduled payments, as well as prepayments, and maturities from portfolios of
loans and investment securities also provide a stable source of funds. FHLB advances, other secured borrowings, Federal funds purchased and other short-
term borrowed funds, as well as long-term debt issued through the capital markets, all provide supplemental liquidity sources. Funding activities are
monitored and governed through BB&T’s overall asset/liability management process, which is further discussed in the “Market Risk Management” section
in “Management’s Discussion and Analysis of Financial Condition and Results of Operations” herein. The following section provides a brief description of
the various sources of funds.
63
Source: BB&T CORP, 10-K, February 25, 2015 Powered by Morningstar® Document Research℠
The information contained herein may not be copied, adapted or distributed and is not warranted to be accurate, complete or timely. The user assumes all risks for any damages or losses arising from any use of this information,
except to the extent such damages or losses cannot be limited or excluded by applicable law. Past financial performance is no guarantee of future results.