BB&T 2014 Annual Report Download - page 93
Download and view the complete annual report
Please find page 93 of the 2014 BB&T annual report below. You can navigate through the pages in the report by either clicking on the pages listed below, or by using the keyword search tool below to find specific information within the annual report.-
 1
1 -
2
-
3
-
4
-
5
-
6
-
7
-
8
-
9
-
10
-
11
-
12
-
13
-
14
-
15
-
16
-
17
-
18
-
19
-
20
-
21
-
22
-
23
-
24
-
25
-
26
-
27
-
28
-
29
-
30
-
31
-
32
-
33
-
34
-
35
-
36
-
37
-
38
-
39
-
40
-
41
-
42
-
43
-
44
-
45
-
46
-
47
-
48
-
49
-
50
-
51
-
52
-
53
-
54
-
55
-
56
-
57
-
58
-
59
-
60
-
61
-
62
-
63
-
64
-
65
-
66
-
67
-
68
-
69
-
70
-
71
-
72
-
73
-
74
-
75
-
76
-
77
-
78
-
79
-
80
-
81
-
82
-
 83
83 -
 84
84 -
 85
85 -
 86
86 -
 87
87 -
 88
88 -
 89
89 -
 90
90 -
 91
91 -
 92
92 -
 93
93 -
 94
94 -
 95
95 -
 96
96 -
 97
97 -
 98
98 -
 99
99 -
 100
100 -
 101
101 -
 102
102 -
 103
103 -
104
-
105
-
106
-
107
-
108
-
109
-
110
-
111
-
112
-
113
-
114
-
115
-
116
-
117
-
118
-
119
-
120
-
121
-
122
-
123
-
124
-
125
-
126
-
127
-
128
-
129
-
130
-
131
-
132
-
133
-
134
-
135
-
136
-
137
-
138
-
139
-
140
-
141
-
142
-
143
-
144
-
145
-
146
-
147
-
148
-
149
-
150
-
151
-
152
-
153
-
154
-
155
-
156
-
157
-
158
-
159
-
160
-
161
-
162
-
163
-
164
 |
 |

Table of Contents
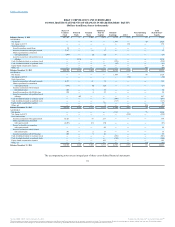
Net income $ 2,226 $ 1,729 $ 2,028
Adjustments to reconcile net income to net cash from operating activities:
Provision for credit losses 251 592 1,057
Adjustment to income tax provision (39) 516 ―
Depreciation 333 315 281
Amortization of intangibles 91 106 110
Deferred tax expense 127 288 419
Equity-based compensation 102 96 97
(Gain) loss on securities, net 3 (51) 12
Net write-downs/losses on foreclosed property 22 28 168
Net change in operating assets and liabilities:
LHFS (201) 2,445 (433)
Other assets 280 92 (210)
Accounts payable and other liabilities (4) (812) 346
Other, net 67 (5) (161)
Net cash from operating activities 3,258 5,339 3,714
Proceeds from sales of AFS securities 1,309 2,209 303
Proceeds from maturities, calls and paydowns of AFS securities 3,915 6,214 4,396
Purchases of AFS securities (3,685) (6,463) (7,026)
Proceeds from maturities, calls and paydowns of HTM securities 1,866 2,863 5,536
Purchases of HTM securities (4,030) (7,399) (5,055)
Originations and purchases of loans and leases, net of principal collected (5,041) (3,077) (6,651)
Net cash from divestitures ― 522 ―
Net cash from business combinations 1,025 (6) 675
Proceeds from sales of foreclosed property 239 394 799
Other, net 339 503 (24)
Net cash from investing activities (4,063) (4,240) (7,047)
Net change in deposits 337 (5,600) 4,676
Net change in short-term borrowings (421) 1,274 (702)
Proceeds from issuance of long-term debt 5,510 4,164 2,327
Repayment of long-term debt (3,912) (1,634) (5,112)
Net proceeds from preferred stock issued ― 487 2,116
Cash dividends paid on common stock (666) (765) (531)
Cash dividends paid on preferred stock (148) (147) (33)
Other, net 265 248 55
Net cash from financing activities 965 (1,973) 2,796
160 (874) (537)
2,165 3,039 3,576
$ 2,325 $ 2,165 $ 3,039
Cash paid (received) during the period for:
Interest $ 765 $ 918 $ 1,120
Income taxes 322 677 347
Noncash investing and financing activities:
Transfers of loans to foreclosed assets 547 609 770
Transfers of loans held for investment to LHFS 684 ― ―
The accompanying notes are an integral part of these consolidated financial statements.
92
Source: BB&T CORP, 10-K, February 25, 2015 Powered by Morningstar® Document Research℠
The information contained herein may not be copied, adapted or distributed and is not warranted to be accurate, complete or timely. The user assumes all risks for any damages or losses arising from any use of this information,
except to the extent such damages or losses cannot be limited or excluded by applicable law. Past financial performance is no guarantee of future results.