BB&T 2014 Annual Report Download - page 145
Download and view the complete annual report
Please find page 145 of the 2014 BB&T annual report below. You can navigate through the pages in the report by either clicking on the pages listed below, or by using the keyword search tool below to find specific information within the annual report.-
 1
1 -
2
-
3
-
4
-
5
-
6
-
7
-
8
-
9
-
10
-
11
-
12
-
13
-
14
-
15
-
16
-
17
-
18
-
19
-
20
-
21
-
22
-
23
-
24
-
25
-
26
-
27
-
28
-
29
-
30
-
31
-
32
-
33
-
34
-
35
-
36
-
37
-
38
-
39
-
40
-
41
-
42
-
43
-
44
-
45
-
46
-
47
-
48
-
49
-
50
-
51
-
52
-
53
-
54
-
55
-
56
-
57
-
58
-
59
-
60
-
61
-
62
-
63
-
64
-
65
-
66
-
67
-
68
-
69
-
70
-
71
-
72
-
73
-
74
-
75
-
76
-
77
-
78
-
79
-
80
-
81
-
82
-
83
-
84
-
85
-
86
-
87
-
88
-
89
-
90
-
91
-
92
-
93
-
94
-
95
-
96
-
97
-
98
-
99
-
100
-
101
-
102
-
103
-
104
-
105
-
106
-
107
-
108
-
109
-
110
-
111
-
112
-
113
-
114
-
115
-
116
-
117
-
118
-
119
-
120
-
121
-
122
-
123
-
124
-
125
-
126
-
127
-
128
-
129
-
130
-
131
-
132
-
133
-
134
-
 135
135 -
 136
136 -
 137
137 -
 138
138 -
 139
139 -
 140
140 -
 141
141 -
 142
142 -
 143
143 -
 144
144 -
 145
145 -
 146
146 -
 147
147 -
 148
148 -
 149
149 -
 150
150 -
 151
151 -
 152
152 -
 153
153 -
 154
154 -
 155
155 -
156
-
157
-
158
-
159
-
160
-
161
-
162
-
163
-
164
 |
 |

Table of Contents
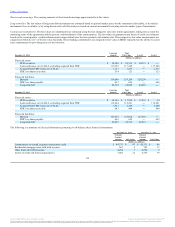
Basic and diluted EPS calculations are presented in the following table:
Net income available to common shareholders $ 2,003 $ 1,562 $ 1,916
Weighted average number of common shares 718,140 703,042 698,739
Effect of dilutive outstanding equity-based awards 10,232 11,321 10,138
Weighted average number of diluted common shares 728,372 714,363 708,877
Basic EPS $ 2.79 $ 2.22 $ 2.74
Diluted EPS $ 2.75 $ 2.19 $ 2.70
Anti-dilutive equity-based awards 14,333 28,456 36,589
BB&T's operations are divided into six reportable business segments that have been identified based on BB&T’s organizational structure. The segments
require unique technology and marketing strategies and offer different products and services through a number of distinct branded LOBs. While BB&T is
managed as an integrated organization, individual executive managers are held accountable for the operations of these business segments.
BB&T emphasizes revenue growth by focusing on client service, sales effectiveness and relationship management along with an organizational focus on
referring clients between LOBs. The business objective is to provide BB&T’s entire suite of products to our clients with the end goal of providing our clients
the best financial experience in the marketplace. The segment results contained herein are presented based on internal management accounting policies that
were designed to support these strategic objectives. Unlike financial accounting, there is no comprehensive authoritative body of guidance for management
accounting equivalent to GAAP. The performance of the segments is not comparable with BB&T’s consolidated results or with similar information presented
by any other financial institution. Additionally, because of the interrelationships of the various segments, the information presented is not indicative of how
the segments would perform if they operated as independent entities.
The management accounting process uses various estimates and allocation methodologies to measure the performance of the operating segments. To
determine financial performance for each segment, BB&T allocates capital, funding charges and credits, an allocated provision for loan and lease losses,
certain noninterest expenses and income tax provisions to each segment, as applicable. To promote revenue growth, certain revenues are reflected in
noninterest income in the individual segment results and also allocated to Community Banking and Financial Services. These allocated revenues are
reflected in intersegment net referral fees and eliminated in Other, Treasury and Corporate. Additionally certain client groups of Community Banking have
also been identified as clients of other LOBs within the business segments. Periodically, existing clients within the Community Banking segment may be
identified and assigned as wealth and private banking clients. At the time of identification, these clients’ loan and deposit balances are reported in the
Financial Services segment from the time of assignment forward. The net interest income and associated net FTP associated with these customers’ loans and
deposits is accounted for in Community Banking in the respective line categories of net interest income (expense) and net intersegment interest income
(expense). For the Commercial Finance LOB and the Wealth Division, NIM and net intersegment interest income have been combined in the net intersegment
interest income (expense) line with an appropriate offsetting amount to the Other, Treasury and Corporate line item to ensure consolidated totals reflect the
Company’s total NIM for loans and deposits. Allocation methodologies are subject to periodic adjustment as the internal management accounting system is
revised and business or product lines within the segments change. Also, because the development and application of these methodologies is a dynamic
process, the financial results presented may be periodically revised.
BB&T utilizes an FTP system to eliminate the effect of interest rate risk from the segments’ net interest income because such risk is centrally managed within
the Treasury function. The FTP system credits or charges the segments with the economic value or cost of the funds the segments create or use. The net FTP
credit or charge, which includes intercompany interest income and expense, is reflected as net intersegment income (expense) in the accompanying tables.
144
Source: BB&T CORP, 10-K, February 25, 2015 Powered by Morningstar® Document Research℠
The information contained herein may not be copied, adapted or distributed and is not warranted to be accurate, complete or timely. The user assumes all risks for any damages or losses arising from any use of this information,
except to the extent such damages or losses cannot be limited or excluded by applicable law. Past financial performance is no guarantee of future results.