BB&T 2014 Annual Report Download - page 31
Download and view the complete annual report
Please find page 31 of the 2014 BB&T annual report below. You can navigate through the pages in the report by either clicking on the pages listed below, or by using the keyword search tool below to find specific information within the annual report.-
 1
1 -
2
-
3
-
4
-
5
-
6
-
7
-
8
-
9
-
10
-
11
-
12
-
13
-
14
-
15
-
16
-
17
-
18
-
19
-
20
-
 21
21 -
 22
22 -
 23
23 -
 24
24 -
 25
25 -
 26
26 -
 27
27 -
 28
28 -
 29
29 -
 30
30 -
 31
31 -
 32
32 -
 33
33 -
 34
34 -
 35
35 -
 36
36 -
 37
37 -
 38
38 -
 39
39 -
 40
40 -
 41
41 -
42
-
43
-
44
-
45
-
46
-
47
-
48
-
49
-
50
-
51
-
52
-
53
-
54
-
55
-
56
-
57
-
58
-
59
-
60
-
61
-
62
-
63
-
64
-
65
-
66
-
67
-
68
-
69
-
70
-
71
-
72
-
73
-
74
-
75
-
76
-
77
-
78
-
79
-
80
-
81
-
82
-
83
-
84
-
85
-
86
-
87
-
88
-
89
-
90
-
91
-
92
-
93
-
94
-
95
-
96
-
97
-
98
-
99
-
100
-
101
-
102
-
103
-
104
-
105
-
106
-
107
-
108
-
109
-
110
-
111
-
112
-
113
-
114
-
115
-
116
-
117
-
118
-
119
-
120
-
121
-
122
-
123
-
124
-
125
-
126
-
127
-
128
-
129
-
130
-
131
-
132
-
133
-
134
-
135
-
136
-
137
-
138
-
139
-
140
-
141
-
142
-
143
-
144
-
145
-
146
-
147
-
148
-
149
-
150
-
151
-
152
-
153
-
154
-
155
-
156
-
157
-
158
-
159
-
160
-
161
-
162
-
163
-
164
 |
 |
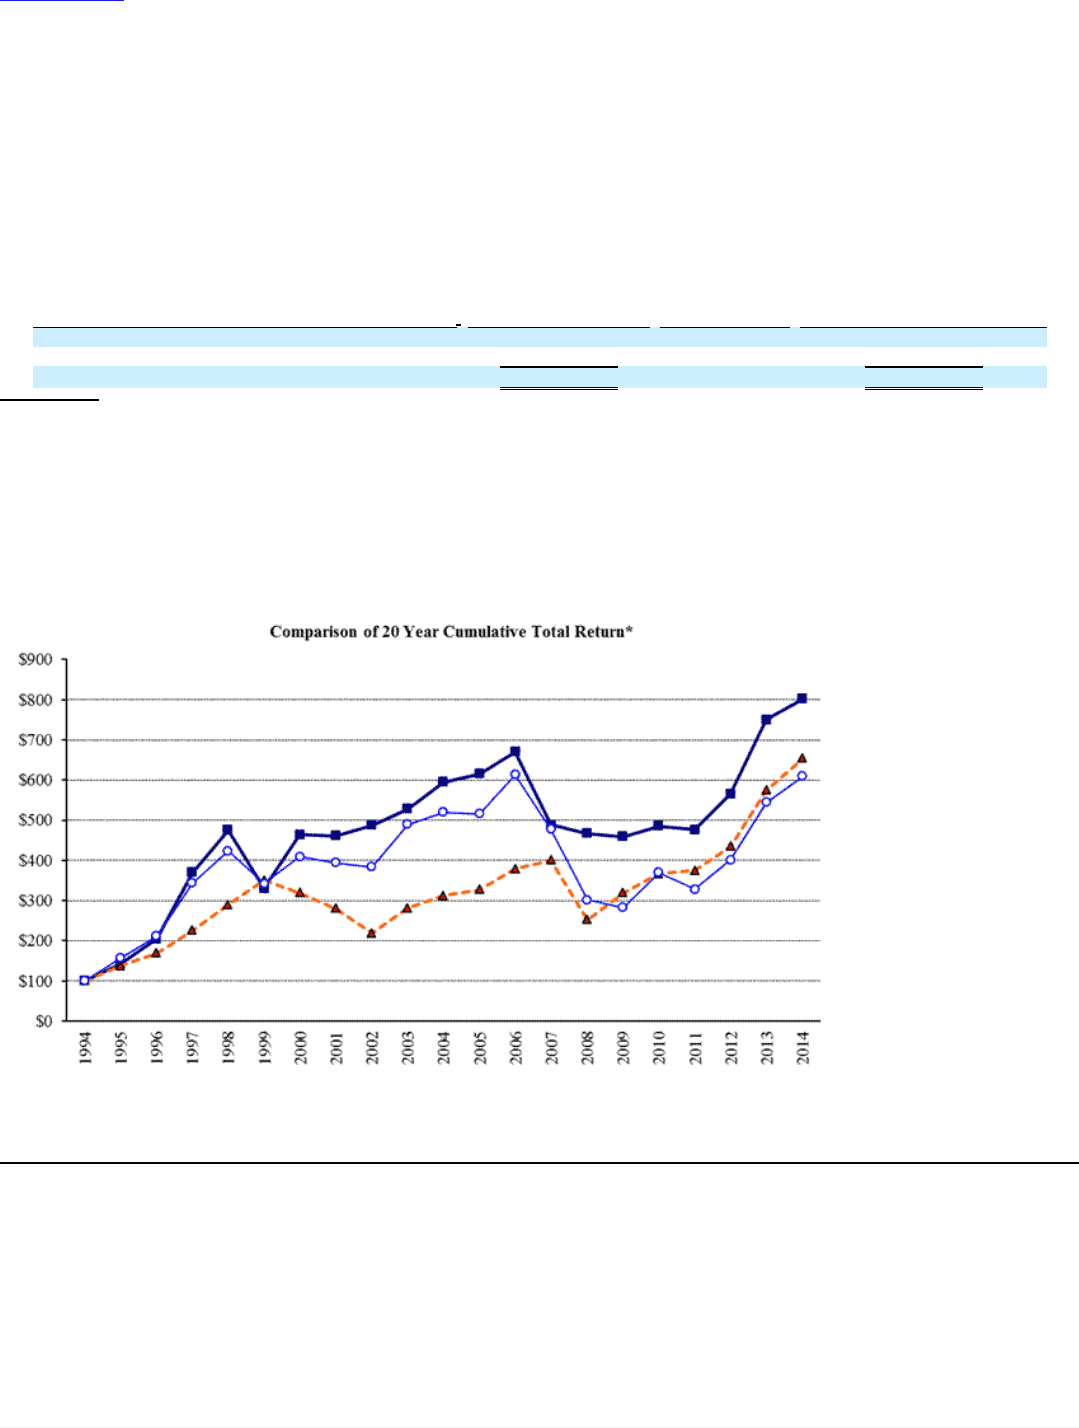
Table of Contents
Preferred Stock
See Note 11 “Shareholders’ Equity” in the “Notes to Consolidated Financial Statements” for information about BB&T’s preferred stock.
Equity Compensation Plan Information
The following table provides information concerning securities to be issued upon the exercise of outstanding equity-based awards, the weighted average
price of such awards and the securities remaining available for future issuance as of December 31, 2014.
Approved by security holders 40,195,870 $ 35.09 26,832,221
Not approved by security holders ― ― ―
Total 40,195,870 35.09 26,832,221
(1) Includes 11,821,700 RSUs.
(2) Excludes RSUs because they do not have an exercise price.
(3) All awards remaining available for future issuance will be issued under the terms of the 2012 Incentive Plan.
Performance Graph
Set forth below are graphs comparing the total returns (assuming reinvestment of dividends) of BB&T common stock, the S&P 500 Index, and an industry
Peer Group. The Peer Group consists of FHCs and BHCs with assets between approximately $50 billion and $410 billion as of December 31, 2014. The
companies in the Peer Group were Comerica Incorporated, Fifth-Third Bancorp, Huntington Bancshares, Incorporated, KeyCorp, M&T Bank Corporation,
PNC Financial Services Group, Inc., Regions Financial Corporation, SunTrust Banks, Inc., U.S. Bancorp and Zions Bancorporation.
30
Source: BB&T CORP, 10-K, February 25, 2015 Powered by Morningstar® Document Research℠
The information contained herein may not be copied, adapted or distributed and is not warranted to be accurate, complete or timely. The user assumes all risks for any damages or losses arising from any use of this information,
except to the extent such damages or losses cannot be limited or excluded by applicable law. Past financial performance is no guarantee of future results.