BB&T 2014 Annual Report Download - page 126
Download and view the complete annual report
Please find page 126 of the 2014 BB&T annual report below. You can navigate through the pages in the report by either clicking on the pages listed below, or by using the keyword search tool below to find specific information within the annual report.-
 1
1 -
2
-
3
-
4
-
5
-
6
-
7
-
8
-
9
-
10
-
11
-
12
-
13
-
14
-
15
-
16
-
17
-
18
-
19
-
20
-
21
-
22
-
23
-
24
-
25
-
26
-
27
-
28
-
29
-
30
-
31
-
32
-
33
-
34
-
35
-
36
-
37
-
38
-
39
-
40
-
41
-
42
-
43
-
44
-
45
-
46
-
47
-
48
-
49
-
50
-
51
-
52
-
53
-
54
-
55
-
56
-
57
-
58
-
59
-
60
-
61
-
62
-
63
-
64
-
65
-
66
-
67
-
68
-
69
-
70
-
71
-
72
-
73
-
74
-
75
-
76
-
77
-
78
-
79
-
80
-
81
-
82
-
83
-
84
-
85
-
86
-
87
-
88
-
89
-
90
-
91
-
92
-
93
-
94
-
95
-
96
-
97
-
98
-
99
-
100
-
101
-
102
-
103
-
104
-
105
-
106
-
107
-
108
-
109
-
110
-
111
-
112
-
113
-
114
-
115
-
 116
116 -
 117
117 -
 118
118 -
 119
119 -
 120
120 -
 121
121 -
 122
122 -
 123
123 -
 124
124 -
 125
125 -
 126
126 -
 127
127 -
 128
128 -
 129
129 -
 130
130 -
 131
131 -
 132
132 -
 133
133 -
 134
134 -
 135
135 -
 136
136 -
137
-
138
-
139
-
140
-
141
-
142
-
143
-
144
-
145
-
146
-
147
-
148
-
149
-
150
-
151
-
152
-
153
-
154
-
155
-
156
-
157
-
158
-
159
-
160
-
161
-
162
-
163
-
164
 |
 |

Table of Contents
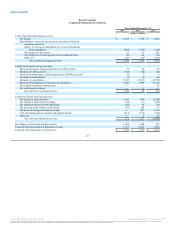
Net Periodic Pension Cost:
Service cost $ 138 $ 150 $ 120
Interest cost 140 120 110
Estimated return on plan assets (296) (257) (200)
Net amortization and other 17 91 76
Net periodic benefit cost (1) 104 106
Pre-Tax Amounts Recognized in OCI:
Net actuarial loss (gain) 532 (535) 270
Net amortization (17) (91) (76)
Net amount recognized in OCI 515 (626) 194
Total net periodic pension costs (income) recognized in
total comprehensive income, pre-tax $ 514 $ (522) $ 300
The following actuarial assumptions were used to determine benefit obligations:
Weighted average assumed discount rate 4.27 % 5.10 %
Assumed rate of annual compensation increases 4.50 5.00
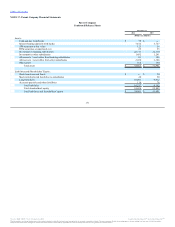
Projected benefit obligation, beginning of year $ 2,437 $ 2,548 $ 304 $ 287
Service cost 128 139 10 11
Interest cost 124 107 16 12
Actuarial (gain) loss 607 (294) 45 2
Benefits paid (69) (63) (8) (8)
Projected benefit obligation, end of year $ 3,227 $ 2,437 $ 367 $ 304
Accumulated benefit obligation, end of year $ 2,744 $ 2,062 $ 295 $ 215
Fair value of plan assets, beginning of year $ 3,733 $ 2,952 $ — $ —
Actual return on plan assets 416 499 — —
Employer contributions 143 345 8 8
Benefits paid (69) (63) (8) (8)
Fair value of plan assets, end of year $ 4,223 $ 3,733 $ — $ —
Funded status at end of year $ 996 $ 1,296 $ (367) $ (304)
The following are the pre-tax amounts recognized in AOCI:
Prior service credit (cost) $ - $ - $ (2) $ (2)
Net actuarial loss (859) (377) (149) (117)
Net amount recognized $ (859) $ (377) $ (151) $ (119)
125
Source: BB&T CORP, 10-K, February 25, 2015 Powered by Morningstar® Document Research℠
The information contained herein may not be copied, adapted or distributed and is not warranted to be accurate, complete or timely. The user assumes all risks for any damages or losses arising from any use of this information,
except to the extent such damages or losses cannot be limited or excluded by applicable law. Past financial performance is no guarantee of future results.