BB&T 2014 Annual Report Download - page 59
Download and view the complete annual report
Please find page 59 of the 2014 BB&T annual report below. You can navigate through the pages in the report by either clicking on the pages listed below, or by using the keyword search tool below to find specific information within the annual report.-
 1
1 -
2
-
3
-
4
-
5
-
6
-
7
-
8
-
9
-
10
-
11
-
12
-
13
-
14
-
15
-
16
-
17
-
18
-
19
-
20
-
21
-
22
-
23
-
24
-
25
-
26
-
27
-
28
-
29
-
30
-
31
-
32
-
33
-
34
-
35
-
36
-
37
-
38
-
39
-
40
-
41
-
42
-
43
-
44
-
45
-
46
-
47
-
48
-
 49
49 -
 50
50 -
 51
51 -
 52
52 -
 53
53 -
 54
54 -
 55
55 -
 56
56 -
 57
57 -
 58
58 -
 59
59 -
 60
60 -
 61
61 -
 62
62 -
 63
63 -
 64
64 -
 65
65 -
 66
66 -
 67
67 -
 68
68 -
 69
69 -
70
-
71
-
72
-
73
-
74
-
75
-
76
-
77
-
78
-
79
-
80
-
81
-
82
-
83
-
84
-
85
-
86
-
87
-
88
-
89
-
90
-
91
-
92
-
93
-
94
-
95
-
96
-
97
-
98
-
99
-
100
-
101
-
102
-
103
-
104
-
105
-
106
-
107
-
108
-
109
-
110
-
111
-
112
-
113
-
114
-
115
-
116
-
117
-
118
-
119
-
120
-
121
-
122
-
123
-
124
-
125
-
126
-
127
-
128
-
129
-
130
-
131
-
132
-
133
-
134
-
135
-
136
-
137
-
138
-
139
-
140
-
141
-
142
-
143
-
144
-
145
-
146
-
147
-
148
-
149
-
150
-
151
-
152
-
153
-
154
-
155
-
156
-
157
-
158
-
159
-
160
-
161
-
162
-
163
-
164
 |
 |

Table of Contents
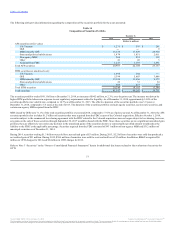
Nonaccrual loans and leases:
Commercial and industrial $ 239 $ 363 $ 545 $ 582 $ 508
CRE - income producing properties 74 113 171 275 212
CRE - construction and development 26 51 170 495 706
Direct retail lending (1) 48 109 132 142 191
Sales finance 5 5 7 7 6
Residential mortgage (1)(2)(3) 166 243 269 308 466
Other lending subsidiaries (2)(4) 58 51 86 63 60
Total nonaccrual loans and leases HFI (3)(4) 616 935 1,380 1,872 2,149
Nonaccrual LHFS ― ― ― ― 521
Total nonaccrual loans and leases (3)(4) 616 935 1,380 1,872 2,670
Foreclosed real estate 87 71 107 536 1,259
Foreclosed real estate-acquired from FDIC 56 121 254 378 313
Other foreclosed property 23 47 49 42 42
Total NPAs (3)(4) $ 782 $ 1,174 $ 1,790 $ 2,828 $ 4,284
Loans 90 days or more past due and still accruing:
Commercial and industrial $ ― $ ― $ 1 $ 2 $ 8
CRE - income producing properties ― ― ― ― 3
CRE - construction and development ― ― ― ― 9
Direct retail lending (1) 12 33 38 56 79
Sales finance 5 5 10 18 27
Revolving credit 9 10 16 17 20
Residential mortgage (1) 83 69 91 103 143
Residential mortgage-government guaranteed (5) 238 296 252 204 152
Other lending subsidiaries ― 5 10 5 6
Acquired from FDIC 188 304 442 736 1,147
Total loans 90 days or more past due and still accruing (5) $ 535 $ 722 $ 860 $ 1,141 $ 1,594
Loans 30-89 days past due and still accruing:
Commercial and industrial $ 23 $ 35 $ 42 $ 85 $ 163
CRE - income producing properties 4 8 11 18 52
CRE - construction and development 1 2 3 18 100
Direct retail lending (1) 41 132 145 162 190
Sales finance 62 56 56 75 95
Revolving credit 23 23 23 22 28
Residential mortgage (1)(2) 392 454 477 450 511
Residential mortgage-government guaranteed (6) 80 88 84 74 74
Other lending subsidiaries (2)(4) 237 221 290 273 248
Acquired from FDIC 33 88 135 222 363
Total loans 30 - 89 days past due and still accruing (4)(6) $ 896 $ 1,107 $ 1,266 $ 1,399 $ 1,824
(1) During the first quarter of 2014, approximately $55 million of nonaccrual loans, $22 million of loans 90 days or more past due and $83 million of loans
30-89 days past due were transferred from direct retail lending to residential mortgage.
(2) During the fourth quarter of 2013, approximately $16 million of nonaccrual loans and $40 million of loans 30-89 days past due were transferred from
other lending subsidiaries to residential mortgage.
(3) During the fourth quarter of 2014, approximately $121 million of nonaccrual residential mortgage loans were sold.
(4) During the fourth quarter of 2013, approximately $9 million of nonaccrual loans and $26 million of loans 30-89 days past due were sold in connection
with the sale of a consumer lending subsidiary.
(5) Excludes government guaranteed GNMA mortgage loans that BB&T does not have the obligation to repurchase that are 90 days or more past due
totaling $410 million, $511 million, $517 million, $426 million and $425 million at December 31, 2014, 2013, 2012, 2011 and 2010, respectively.
58
Source: BB&T CORP, 10-K, February 25, 2015 Powered by Morningstar® Document Research℠
The information contained herein may not be copied, adapted or distributed and is not warranted to be accurate, complete or timely. The user assumes all risks for any damages or losses arising from any use of this information,
except to the extent such damages or losses cannot be limited or excluded by applicable law. Past financial performance is no guarantee of future results.