BB&T 2014 Annual Report Download - page 48
Download and view the complete annual report
Please find page 48 of the 2014 BB&T annual report below. You can navigate through the pages in the report by either clicking on the pages listed below, or by using the keyword search tool below to find specific information within the annual report.-
 1
1 -
2
-
3
-
4
-
5
-
6
-
7
-
8
-
9
-
10
-
11
-
12
-
13
-
14
-
15
-
16
-
17
-
18
-
19
-
20
-
21
-
22
-
23
-
24
-
25
-
26
-
27
-
28
-
29
-
30
-
31
-
32
-
33
-
34
-
35
-
36
-
37
-
 38
38 -
 39
39 -
 40
40 -
 41
41 -
 42
42 -
 43
43 -
 44
44 -
 45
45 -
 46
46 -
 47
47 -
 48
48 -
 49
49 -
 50
50 -
 51
51 -
 52
52 -
 53
53 -
 54
54 -
 55
55 -
 56
56 -
 57
57 -
 58
58 -
59
-
60
-
61
-
62
-
63
-
64
-
65
-
66
-
67
-
68
-
69
-
70
-
71
-
72
-
73
-
74
-
75
-
76
-
77
-
78
-
79
-
80
-
81
-
82
-
83
-
84
-
85
-
86
-
87
-
88
-
89
-
90
-
91
-
92
-
93
-
94
-
95
-
96
-
97
-
98
-
99
-
100
-
101
-
102
-
103
-
104
-
105
-
106
-
107
-
108
-
109
-
110
-
111
-
112
-
113
-
114
-
115
-
116
-
117
-
118
-
119
-
120
-
121
-
122
-
123
-
124
-
125
-
126
-
127
-
128
-
129
-
130
-
131
-
132
-
133
-
134
-
135
-
136
-
137
-
138
-
139
-
140
-
141
-
142
-
143
-
144
-
145
-
146
-
147
-
148
-
149
-
150
-
151
-
152
-
153
-
154
-
155
-
156
-
157
-
158
-
159
-
160
-
161
-
162
-
163
-
164
 |
 |

Table of Contents
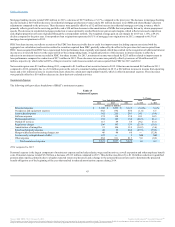
Insurance Services
Insurance Services net income was $233 million in 2014, an increase of $46 million, or 24.6%, compared to 2013.
Insurance Services’ noninterest income of $1.7 billion increased $128 million, primarily due to increased commissions on new and renewal property and
casualty business, higher performance-based commissions and an increase in employee benefit commissions.
Noninterest expense increased $54 million driven by higher salaries, performance-based incentives, operating charge-offs and business referral expense.
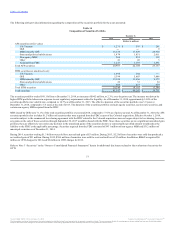
Financial Services
Financial Services net income was $280 million in 2014, a decrease of $23 million, or 7.6%, compared to 2013.
The allocated provision for credit losses increased $7 million compared to the prior year as the result of growth in the Corporate Banking and BB&T Wealth
loan portfolios.
Noninterest income increased $26 million, primarily due to higher trust, investment advisory and investment banking income. Client invested assets totaled
$119.0 billion as of December 31, 2014, an increase of $7.8 billion, or 7.0%, compared to 2013.
Noninterest expense increased $28 million, primarily due to higher personnel expense, operating charge-offs, sub-advisory fees and occupancy and
equipment expense.
Allocated corporate expenses increased $21 million, primarily driven by internal business initiatives and growth in the segment.
Financial Services continues to generate significant loan growth through expanded lending strategies, with Corporate Banking’s average loan balances
increasing $1.7 billion, or 23.3%, compared to 2013, while BB&T Wealth’s average loan balances increased $229 million, or 25.6%. BB&T Wealth also
grew transaction account balances by $438 million, or 18.8%, and money market and savings balances by $575 million, or 9.4%, compared to 2013.
Other, Treasury & Corporate
Other, Treasury & Corporate net income was $149 million in 2014 compared to a net loss of $509 million in 2013. Results in the prior year include $516
million in adjustments for uncertain income tax positions as previously described.
Segment net interest income increased $103 million to $401 million, primarily due to an increase in the investment portfolio, lower funding credits on
deposits allocated to Community Banking and Financial Services and lower corporate borrowing costs, partially offset by runoff in the acquired from FDIC
loan portfolio.
The allocated provision for credit losses was a benefit of $66 million compared to a benefit of $16 million in the prior year. This current year includes a $29
million benefit for loans acquired from the FDIC and a $29 million reduction in the reserve for unfunded lending commitments driven by improvements
related to the mix of lines of credit, letters of credit, and bankers’ acceptances.
Noninterest income decreased $159 million primarily due to lower securities gains in the investment portfolio, lower FDIC loss share income, the sale of a
consumer lending subsidiary during the fourth quarter of 2013 and lower income from assets related to certain post-employment benefits.
Noninterest expense increased $68 million, primarily due to $122 million in expense related to early extinguishment of FHLB debt, and higher outside IT
services and merger-related expense, partially offset by lower personnel, professional services and tax and license expense.
Intersegment net referral fee expense decreased $61 million as the result of a lower level of mortgage banking referral income that was allocated to both
Community Banking and Financial Services.
47
Source: BB&T CORP, 10-K, February 25, 2015 Powered by Morningstar® Document Research℠
The information contained herein may not be copied, adapted or distributed and is not warranted to be accurate, complete or timely. The user assumes all risks for any damages or losses arising from any use of this information,
except to the extent such damages or losses cannot be limited or excluded by applicable law. Past financial performance is no guarantee of future results.