BB&T 2014 Annual Report Download - page 56
Download and view the complete annual report
Please find page 56 of the 2014 BB&T annual report below. You can navigate through the pages in the report by either clicking on the pages listed below, or by using the keyword search tool below to find specific information within the annual report.-
 1
1 -
2
-
3
-
4
-
5
-
6
-
7
-
8
-
9
-
10
-
11
-
12
-
13
-
14
-
15
-
16
-
17
-
18
-
19
-
20
-
21
-
22
-
23
-
24
-
25
-
26
-
27
-
28
-
29
-
30
-
31
-
32
-
33
-
34
-
35
-
36
-
37
-
38
-
39
-
40
-
41
-
42
-
43
-
44
-
45
-
 46
46 -
 47
47 -
 48
48 -
 49
49 -
 50
50 -
 51
51 -
 52
52 -
 53
53 -
 54
54 -
 55
55 -
 56
56 -
 57
57 -
 58
58 -
 59
59 -
 60
60 -
 61
61 -
 62
62 -
 63
63 -
 64
64 -
 65
65 -
 66
66 -
67
-
68
-
69
-
70
-
71
-
72
-
73
-
74
-
75
-
76
-
77
-
78
-
79
-
80
-
81
-
82
-
83
-
84
-
85
-
86
-
87
-
88
-
89
-
90
-
91
-
92
-
93
-
94
-
95
-
96
-
97
-
98
-
99
-
100
-
101
-
102
-
103
-
104
-
105
-
106
-
107
-
108
-
109
-
110
-
111
-
112
-
113
-
114
-
115
-
116
-
117
-
118
-
119
-
120
-
121
-
122
-
123
-
124
-
125
-
126
-
127
-
128
-
129
-
130
-
131
-
132
-
133
-
134
-
135
-
136
-
137
-
138
-
139
-
140
-
141
-
142
-
143
-
144
-
145
-
146
-
147
-
148
-
149
-
150
-
151
-
152
-
153
-
154
-
155
-
156
-
157
-
158
-
159
-
160
-
161
-
162
-
163
-
164
 |
 |

Table of Contents
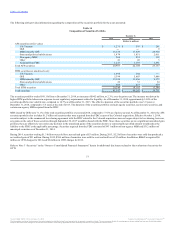
The following table presents the loan portfolio based upon BB&T’s LOBs:
Commercial:
Commercial and industrial $ 41,454 $ 38,508 $ 38,295 $ 36,415 $ 34,050
CRE—income producing properties 10,722 10,228 9,861 8,860 9,083
CRE—construction and development 2,735 2,382 2,861 3,890 5,753
Direct retail lending (1) 8,146 15,869 15,817 14,506 13,807
Sales finance 10,600 9,382 7,736 7,401 7,050
Revolving credit 2,460 2,403 2,330 2,212 2,127
Residential mortgage-nonguaranteed (1) 30,107 23,513 23,189 20,057 17,102
Residential mortgage-government guaranteed 983 1,135 1,083 524 448
Other lending subsidiaries 11,462 10,462 10,137 8,737 7,953
Total loans and leases held for investment
(excluding acquired from FDIC) 118,669 113,882 111,309 102,602 97,373
Acquired from FDIC 1,215 2,035 3,294 4,867 6,194
Total loans and leases held for investment 119,884 115,917 114,603 107,469 103,567
LHFS 1,423 1,222 3,761 3,736 3,697
Total loans and leases $ 121,307 $ 117,139 $ 118,364 $ 111,205 $ 107,264
(1) During the first quarter of 2014, $8.3 billion of loans were transferred from direct retail lending to residential mortgage.
Total loans and leases were $121.3 billion at year-end 2014, an increase of $4.2 billion compared to the balance at year-end 2013. This increase reflects
broad-based loan growth, with commercial and industrial up $2.9 billion, sales finance up $1.2 billion and other lending subsidiaries up $1.0 billion. A
decline in direct retail lending balances and a corresponding increase in residential mortgage balances reflect the impact of an $8.3 billion transfer that
occurred during the first quarter of 2014.
The increase in commercial and industrial loans reflects solid growth from large corporate clients, which typically have strong credit profiles and therefore
put downward pressure on pricing. The yield on commercial and industrial loans declined to 3.35% in 2014 from 3.63% in 2013.
The decline in residential mortgage balances, after excluding the effects of the loan transfer, reflects the competitive environment, lower originations and the
impact of the loans sales previously discussed. Additionally, BB&T implemented a mid-year change in strategy that resulted in originations of loans with
eligible collateral types, including adjustable rate mortgages with 10 and 15 year terms, being directed to the LHFS portfolio.
The acquired from FDIC loan portfolio, which totaled $1.2 billion at December 31, 2014, continued to runoff during the year, resulting in a decline of $820
million compared to the prior year-end.
The majority of BB&T’s loans are with clients in domestic market areas, which are primarily concentrated in the southeastern United States. International
loans were immaterial as of December 31, 2014 and 2013.
The following tables summarize the loan portfolio based on regulatory classifications, which focuses on the underlying loan collateral, and differs from
internal classifications presented herein that focus on the primary purpose of the loan. Acquired from FDIC loans are included in their respective categories.
55
Source: BB&T CORP, 10-K, February 25, 2015 Powered by Morningstar® Document Research℠
The information contained herein may not be copied, adapted or distributed and is not warranted to be accurate, complete or timely. The user assumes all risks for any damages or losses arising from any use of this information,
except to the extent such damages or losses cannot be limited or excluded by applicable law. Past financial performance is no guarantee of future results.