BB&T 2014 Annual Report Download - page 44
Download and view the complete annual report
Please find page 44 of the 2014 BB&T annual report below. You can navigate through the pages in the report by either clicking on the pages listed below, or by using the keyword search tool below to find specific information within the annual report.-
 1
1 -
2
-
3
-
4
-
5
-
6
-
7
-
8
-
9
-
10
-
11
-
12
-
13
-
14
-
15
-
16
-
17
-
18
-
19
-
20
-
21
-
22
-
23
-
24
-
25
-
26
-
27
-
28
-
29
-
30
-
31
-
32
-
33
-
 34
34 -
 35
35 -
 36
36 -
 37
37 -
 38
38 -
 39
39 -
 40
40 -
 41
41 -
 42
42 -
 43
43 -
 44
44 -
 45
45 -
 46
46 -
 47
47 -
 48
48 -
 49
49 -
 50
50 -
 51
51 -
 52
52 -
 53
53 -
 54
54 -
55
-
56
-
57
-
58
-
59
-
60
-
61
-
62
-
63
-
64
-
65
-
66
-
67
-
68
-
69
-
70
-
71
-
72
-
73
-
74
-
75
-
76
-
77
-
78
-
79
-
80
-
81
-
82
-
83
-
84
-
85
-
86
-
87
-
88
-
89
-
90
-
91
-
92
-
93
-
94
-
95
-
96
-
97
-
98
-
99
-
100
-
101
-
102
-
103
-
104
-
105
-
106
-
107
-
108
-
109
-
110
-
111
-
112
-
113
-
114
-
115
-
116
-
117
-
118
-
119
-
120
-
121
-
122
-
123
-
124
-
125
-
126
-
127
-
128
-
129
-
130
-
131
-
132
-
133
-
134
-
135
-
136
-
137
-
138
-
139
-
140
-
141
-
142
-
143
-
144
-
145
-
146
-
147
-
148
-
149
-
150
-
151
-
152
-
153
-
154
-
155
-
156
-
157
-
158
-
159
-
160
-
161
-
162
-
163
-
164
 |
 |

Table of Contents
Mortgage banking income totaled $565 million in 2013, a decrease of $275 million, or 32.7%, compared to the prior year. The decrease in mortgage banking
income includes a $247 million decrease in residential mortgage production revenues and a $61 million decrease in net MSR and related hedge valuation
adjustments compared to the prior year. These decreases were partially offset by a $12 million increase in residential mortgage servicing revenues, which
primarily reflects growth in the servicing portfolio, and a $28 million decrease in the amortization of MSRs that was primarily driven by slower prepayment
speeds. The decrease in residential mortgage production revenues primarily resulted from lower gain on sale margins, which reflects increased competition
and a higher proportion of loans originated through the correspondent network. The weighted average gain on sale margin for 2013 was 1.15%, a 49.2%
decline compared to the prior year. Correspondent loan originations represented 65.1% of mortgage loan originations in 2013, compared to 60.5% of
mortgage loan originations in 2012.
FDIC loss share income, net reflects accretion of the FDIC loss share receivable due to credit loss improvement (including expense associated with the
aggregate loss calculation) and accretion related to securities acquired from FDIC, partially reduced by the offset to the provision for loans acquired from
FDIC. Loans acquired from FDIC have experienced better performance than originally anticipated, which has resulted in the recognition of additional interest
income on a level yield basis over the expected life of the corresponding loans. A significant portion of this increase in interest income is offset by a
reduction in noninterest income recorded in FDIC loss share income. For 2013, noninterest income was reduced by $255 million related to improvement in
loan performance compared to a reduction of $271 million in 2012. These decreases in income were partially offset by increases of $4 million and $11
million, respectively, which reflected 80% of the provision for credit losses recorded on loans acquired from FDIC for 2013 and 2012.
Net securities gains were $51 million during 2013, compared to $12 million of net securities losses in 2012. Other income increased $63 million in 2013
compared to 2012, primarily due to a $31 million gain on the sale of a consumer lending subsidiary in 2013, a $22 million increase in income from operating
leases and a $21 million increase in income from assets related to certain post-employment benefits, which is offset in personnel expense. These increases
were partially offset by a $10 million decrease in client derivative related activities.
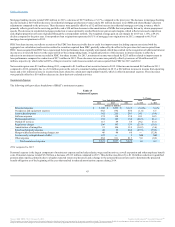
Noninterest Expense
The following table provides a breakdown of BB&T’s noninterest expense:
Personnel expense $ 3,180 $ 3,293 $ 3,125 (3.4)% 5.4 %
Occupancy and equipment expense 682 692 650 (1.4) 6.5
Loan-related expense 342 255 283 34.1 (9.9)
Software expense 174 158 138 10.1 14.5
Professional services 139 189 156 (26.5) 21.2
Outside IT services 115 89 58 29.2 53.4
Regulatory charges 106 143 159 (25.9) (10.1)
Amortization of intangibles 91 106 110 (14.2) (3.6)
Foreclosed property expense 40 55 266 (27.3) (79.3)
Merger-related and restructuring charges, net 46 46 68 ― (32.4)
Loss on early extinguishment of debt 122 ― 2 NM NM
Other expense 884 811 813 9.0 (0.2)
Total noninterest expense $ 5,921 $ 5,837 $ 5,828 1.4 0.2
2014 compared to 2013
Personnel expense is the largest component of noninterest expense and includes salaries, wages and incentives, as well as pension and other employee benefit
costs. Personnel expense totaled $3.2 billion, a decrease of $113 million compared to 2013. This decline was driven by a $110 million reduction in qualified
pension plan expense, primarily due to a higher expected return on plan assets and a change in the actuarial discount rate used to determine the projected
benefit obligation as of the beginning of the year that resulted in reduced amortization expense during 2014.
43
Source: BB&T CORP, 10-K, February 25, 2015 Powered by Morningstar® Document Research℠
The information contained herein may not be copied, adapted or distributed and is not warranted to be accurate, complete or timely. The user assumes all risks for any damages or losses arising from any use of this information,
except to the extent such damages or losses cannot be limited or excluded by applicable law. Past financial performance is no guarantee of future results.