BB&T 2014 Annual Report Download - page 49
Download and view the complete annual report
Please find page 49 of the 2014 BB&T annual report below. You can navigate through the pages in the report by either clicking on the pages listed below, or by using the keyword search tool below to find specific information within the annual report.-
 1
1 -
2
-
3
-
4
-
5
-
6
-
7
-
8
-
9
-
10
-
11
-
12
-
13
-
14
-
15
-
16
-
17
-
18
-
19
-
20
-
21
-
22
-
23
-
24
-
25
-
26
-
27
-
28
-
29
-
30
-
31
-
32
-
33
-
34
-
35
-
36
-
37
-
38
-
 39
39 -
 40
40 -
 41
41 -
 42
42 -
 43
43 -
 44
44 -
 45
45 -
 46
46 -
 47
47 -
 48
48 -
 49
49 -
 50
50 -
 51
51 -
 52
52 -
 53
53 -
 54
54 -
 55
55 -
 56
56 -
 57
57 -
 58
58 -
 59
59 -
60
-
61
-
62
-
63
-
64
-
65
-
66
-
67
-
68
-
69
-
70
-
71
-
72
-
73
-
74
-
75
-
76
-
77
-
78
-
79
-
80
-
81
-
82
-
83
-
84
-
85
-
86
-
87
-
88
-
89
-
90
-
91
-
92
-
93
-
94
-
95
-
96
-
97
-
98
-
99
-
100
-
101
-
102
-
103
-
104
-
105
-
106
-
107
-
108
-
109
-
110
-
111
-
112
-
113
-
114
-
115
-
116
-
117
-
118
-
119
-
120
-
121
-
122
-
123
-
124
-
125
-
126
-
127
-
128
-
129
-
130
-
131
-
132
-
133
-
134
-
135
-
136
-
137
-
138
-
139
-
140
-
141
-
142
-
143
-
144
-
145
-
146
-
147
-
148
-
149
-
150
-
151
-
152
-
153
-
154
-
155
-
156
-
157
-
158
-
159
-
160
-
161
-
162
-
163
-
164
 |
 |

Table of Contents
The credit for allocated corporate expenses increased $150 million compared to the prior year primarily related to investments in application systems and
business initiatives allocated to the other segments and centralization of certain business activities into corporate functions to allow for efficiencies.
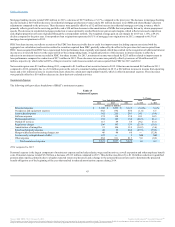
2013 compared to 2012
Community Banking
Community Banking had a network of 1,825 banking offices at the end of 2013, a decrease of seven offices compared to December 31, 2012. The decrease in
offices was driven by the closure of low volume branches, partially offset by de novo branch openings.
Community Banking net income was $891 million in 2013, an increase of $173 million, or 24.1%, compared to 2012.
Segment net interest income totaled $3.0 billion, a decrease of $185 million compared to 2012. The decrease in segment net interest income was primarily
attributable to lower funding spreads earned on deposits, partially offset by improvements in deposit mix as a result of growth in noninterest-bearing
deposits, money market and savings deposits and a decrease in certificates of deposits.
The allocated provision for loan and lease losses decreased $307 million as the result of lower business and consumer loan charge-offs.
Noninterest income of $1.2 billion increased $60 million, primarily due to higher checkcard fees, bankcard fees, merchant discounts and service charges on
deposits.
Noninterest expense of $1.7 billion decreased $123 million, primarily driven by lower foreclosed property, regulatory and professional services expense.
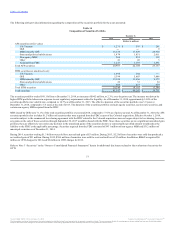
Residential Mortgage Banking
Residential Mortgage Banking net income was $383 million in 2013, a decrease of $6 million, or 1.5%, compared to 2012.
Mortgage originations totaled $31.6 billion in 2013, a decrease of $1.5 billion, or 4.5%, compared to $33.1 billion in 2012. BB&T’s residential mortgage
servicing portfolio, which includes both retained loans and loans serviced for others, totaled $121.2 billion at the end of 2013, compared to $110.1 billion at
December 31, 2012.
Segment net interest income increased $65 million to $585 million. The increase in segment net interest income was driven by growth in loans held for
investment, which was partially attributable to the decision to begin retaining certain originated mortgage loans, and higher credit spreads on average loan
balances.
The allocated provision for loan and lease losses decreased $162 million, primarily reflecting an improvement in mix due to the runoff of lower quality loans.
Net charge-offs of $78 million were recorded in 2013, compared to $133 million in 2012, as nonaccrual and aged loans (excluding guaranteed loans)
decreased during the period.
Noninterest income decreased $272 million, primarily driven by lower gain on sale margins, which reflects increased competition and a higher proportion of
loans originated through the correspondent network, and a decrease in net MSR valuation adjustments.
Noninterest expense decreased $46 million primarily due to lower foreclosure-related expense and lower expense associated with mortgage repurchase
reserves.
Dealer Financial Services
Dealer Financial Services net income was $204 million in 2013, a decrease of $15 million, or 6.8%, compared to 2012.
Segment net interest income of $676 million increased $27 million, primarily the result of loan growth and wider credit spreads in the Regional Acceptance
Corporation portfolio. Dealer Financial Services average loans grew by $840 million, or 8.5%, compared to 2012.
48
Source: BB&T CORP, 10-K, February 25, 2015 Powered by Morningstar® Document Research℠
The information contained herein may not be copied, adapted or distributed and is not warranted to be accurate, complete or timely. The user assumes all risks for any damages or losses arising from any use of this information,
except to the extent such damages or losses cannot be limited or excluded by applicable law. Past financial performance is no guarantee of future results.