BB&T 2014 Annual Report Download - page 148
Download and view the complete annual report
Please find page 148 of the 2014 BB&T annual report below. You can navigate through the pages in the report by either clicking on the pages listed below, or by using the keyword search tool below to find specific information within the annual report.-
 1
1 -
2
-
3
-
4
-
5
-
6
-
7
-
8
-
9
-
10
-
11
-
12
-
13
-
14
-
15
-
16
-
17
-
18
-
19
-
20
-
21
-
22
-
23
-
24
-
25
-
26
-
27
-
28
-
29
-
30
-
31
-
32
-
33
-
34
-
35
-
36
-
37
-
38
-
39
-
40
-
41
-
42
-
43
-
44
-
45
-
46
-
47
-
48
-
49
-
50
-
51
-
52
-
53
-
54
-
55
-
56
-
57
-
58
-
59
-
60
-
61
-
62
-
63
-
64
-
65
-
66
-
67
-
68
-
69
-
70
-
71
-
72
-
73
-
74
-
75
-
76
-
77
-
78
-
79
-
80
-
81
-
82
-
83
-
84
-
85
-
86
-
87
-
88
-
89
-
90
-
91
-
92
-
93
-
94
-
95
-
96
-
97
-
98
-
99
-
100
-
101
-
102
-
103
-
104
-
105
-
106
-
107
-
108
-
109
-
110
-
111
-
112
-
113
-
114
-
115
-
116
-
117
-
118
-
119
-
120
-
121
-
122
-
123
-
124
-
125
-
126
-
127
-
128
-
129
-
130
-
131
-
132
-
133
-
134
-
135
-
136
-
137
-
 138
138 -
 139
139 -
 140
140 -
 141
141 -
 142
142 -
 143
143 -
 144
144 -
 145
145 -
 146
146 -
 147
147 -
 148
148 -
 149
149 -
 150
150 -
 151
151 -
 152
152 -
 153
153 -
 154
154 -
 155
155 -
 156
156 -
 157
157 -
 158
158 -
159
-
160
-
161
-
162
-
163
-
164
 |
 |

Table of Contents
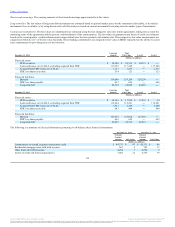
Net interest income (expense) $ 1,726 $ 1,712 $ 1,668 $ 1,482 $ 1,584 $ 1,564 $ 835 $ 834 $ 844 $ 578 $ 678 $ 701
Net intersegment interest income (expense) 1,188 1,336 1,565 (984) (999) (1,044) (160) (158) (195) (146) (126) (139)
Segment net interest income 2,914 3,048 3,233 498 585 520 675 676 649 432 552 562
Allocated provision for loan and lease losses 123 279 586 (107) 12 174 237 214 164 39 85 135
Noninterest income 1,247 1,229 1,169 310 484 756 2 4 7 232 222 216
Intersegment net referral fees (expense) 118 178 190 2 (1) ― ― ― ― ― ― ―
Noninterest expense 1,535 1,692 1,815 504 370 416 116 108 101 219 255 258
Amortization of intangibles 29 36 37 ― ― ― ― ― 1 5 5 5
Allocated corporate expenses 1,137 1,041 1,024 85 68 59 29 29 36 59 65 78
Income (loss) before income taxes 1,455 1,407 1,130 328 618 627 295 329 354 342 364 302
Provision (benefit) for income taxes 532 516 412 124 235 238 112 125 135 88 94 65
Segment net income (loss) $ 923 $ 891 $ 718 $ 204 $ 383 $ 389 $ 183 $ 204 $ 219 $ 254 $ 270 $ 237
Identifiable segment assets (period end) $ 55,494 $ 55,666 $ 56,496 $ 34,463 $ 36,083 $ 37,654 $ 12,823 $ 11,525 $ 10,264 $ 18,218 $ 16,564 $ 17,003
Net interest income (expense) $ 2 $ 3 $ 3 $ 183 $ 166 $ 132 $ 568 $ 639 $ 945 $ 5,374 $ 5,616 $ 5,857
Net intersegment interest income (expense) 6 6 4 263 282 303 (167) (341) (494) ― ― ―
Segment net interest income 8 9 7 446 448 435 401 298 451 5,374 5,616 5,857
Allocated provision for loan and lease losses ― ― ― 25 18 11 (66) (16) (13) 251 592 1,057
Noninterest income 1,663 1,535 1,365 770 744 724 (440) (281) (417) 3,784 3,937 3,820
Intersegment net referral fees (expense) ― ― ― 24 28 33 (144) (205) (223) ― ― ―
Noninterest expense 1,189 1,135 1,016 644 616 641 1,623 1,555 1,471 5,830 5,731 5,718
Amortization of intangibles 53 61 61 2 3 3 2 1 3 91 106 110
Allocated corporate expenses 86 64 82 119 98 91 (1,515) (1,365) (1,370) ― ― ―
Income (loss) before income taxes 343 284 213 450 485 446 (227) (363) (280) 2,986 3,124 2,792
Provision (benefit) for income taxes 110 97 70 170 182 169 (376) 146 (325) 760 1,395 764
Segment net income (loss) $ 233 $ 187 $ 143 $ 280 $ 303 $ 277 $ 149 $ (509) $ 45 $ 2,226 $ 1,729 $ 2,028
Identifiable segment assets (period end) $ 2,978 $ 2,990 $ 3,297 $ 12,849 $ 10,001 $ 8,929 $ 49,989 $ 50,181 $ 50,856 $ 186,814 $ 183,010 $ 184,499
(1) Includes financial data from subsidiaries below the quantitative and qualitative thresholds requiring disclosure.
147
Source: BB&T CORP, 10-K, February 25, 2015 Powered by Morningstar® Document Research℠
The information contained herein may not be copied, adapted or distributed and is not warranted to be accurate, complete or timely. The user assumes all risks for any damages or losses arising from any use of this information,
except to the extent such damages or losses cannot be limited or excluded by applicable law. Past financial performance is no guarantee of future results.