BB&T 2014 Annual Report Download - page 138
Download and view the complete annual report
Please find page 138 of the 2014 BB&T annual report below. You can navigate through the pages in the report by either clicking on the pages listed below, or by using the keyword search tool below to find specific information within the annual report.-
 1
1 -
2
-
3
-
4
-
5
-
6
-
7
-
8
-
9
-
10
-
11
-
12
-
13
-
14
-
15
-
16
-
17
-
18
-
19
-
20
-
21
-
22
-
23
-
24
-
25
-
26
-
27
-
28
-
29
-
30
-
31
-
32
-
33
-
34
-
35
-
36
-
37
-
38
-
39
-
40
-
41
-
42
-
43
-
44
-
45
-
46
-
47
-
48
-
49
-
50
-
51
-
52
-
53
-
54
-
55
-
56
-
57
-
58
-
59
-
60
-
61
-
62
-
63
-
64
-
65
-
66
-
67
-
68
-
69
-
70
-
71
-
72
-
73
-
74
-
75
-
76
-
77
-
78
-
79
-
80
-
81
-
82
-
83
-
84
-
85
-
86
-
87
-
88
-
89
-
90
-
91
-
92
-
93
-
94
-
95
-
96
-
97
-
98
-
99
-
100
-
101
-
102
-
103
-
104
-
105
-
106
-
107
-
108
-
109
-
110
-
111
-
112
-
113
-
114
-
115
-
116
-
117
-
118
-
119
-
120
-
121
-
122
-
123
-
124
-
125
-
126
-
127
-
 128
128 -
 129
129 -
 130
130 -
 131
131 -
 132
132 -
 133
133 -
 134
134 -
 135
135 -
 136
136 -
 137
137 -
 138
138 -
 139
139 -
 140
140 -
 141
141 -
 142
142 -
 143
143 -
 144
144 -
 145
145 -
 146
146 -
 147
147 -
 148
148 -
149
-
150
-
151
-
152
-
153
-
154
-
155
-
156
-
157
-
158
-
159
-
160
-
161
-
162
-
163
-
164
 |
 |

Table of Contents
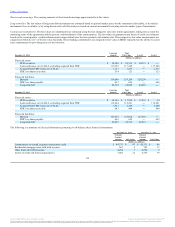
Balance at January 1, 2013 $ 994 $ 627 $ 54 $ 323
Total realized and unrealized gains (losses):
Included in earnings:
Interest income 37 ― ― ―
Mortgage banking income ― 229 21 ―
Other noninterest income ― ― ― 33
Included in unrealized net holding gains (losses) in OCI (14) ― ― ―
Purchases ― ― ― 58
Issuances ― 336 65 ―
Sales ― ― ― (59)
Settlements (156) (145) (151) (64)
Balance at December 31, 2013 $ 861 $ 1,047 $ (11) $ 291
Change in unrealized gains (losses) included in earnings for the period,
attributable to assets and liabilities still held at December 31, 2013 $ 37 $ 229 $ (11) $ 22
Balance at January 1, 2012 $ 984 $ 563 $ 59 $ 261
Total realized and unrealized gains (losses):
Included in earnings:
Interest income 48 ― ― ―
Mortgage banking income ― (32) 458 ―
Other noninterest income ― ― ― 21
Included in unrealized holding gains (losses) in OCI 88 ― ― ―
Purchases ― ― ― 101
Issuances ― 270 308 ―
Sales ― ― ― (59)
Settlements (126) (174) (771) (1)
Balance at December 31, 2012 $ 994 $ 627 $ 54 $ 323
Change in unrealized gains (losses) included in earnings for the period,
attributable to assets and liabilities still held at December 31, 2012 $ 48 $ (32) $ 54 $ 12
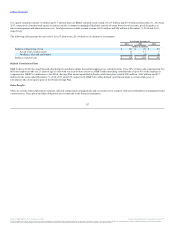
BB&T’s policy is to recognize transfers in and transfers out of Levels 1, 2 and 3 as of the end of a reporting period. Transfers in and out of Level 3 are shown
in the preceding tables.
BB&T’s private equity and similar investments are primarily in SBIC qualified funds, which focus on equity and subordinated debt investments in privately-
held middle market companies. These investments generally are not redeemable and distributions are received as the underlying assets of the funds liquidate.
The timing of distributions, which are expected to occur on various dates through 2025, is uncertain and dependent on various events such as
recapitalizations, refinance transactions and ownership changes among others. Excluding the investment of future funds, BB&T estimates these investments
have a weighted average remaining life of approximately two years; however, the timing and amount of distributions may vary significantly. As of December
31, 2014, restrictions on the ability to sell the investments include, but are not limited to, consent of a majority member or general partner approval for
transfer of ownership. BB&T’s investments are spread over numerous privately-held middle market companies, and thus the sensitivity to a change in fair
value for any single investment is limited. The significant unobservable inputs for these investments are EBITDA multiples that ranged from 4x to 10x, with
a weighted average of 8x, at December 31, 2014.
137
Source: BB&T CORP, 10-K, February 25, 2015 Powered by Morningstar® Document Research℠
The information contained herein may not be copied, adapted or distributed and is not warranted to be accurate, complete or timely. The user assumes all risks for any damages or losses arising from any use of this information,
except to the extent such damages or losses cannot be limited or excluded by applicable law. Past financial performance is no guarantee of future results.