BB&T 2014 Annual Report Download - page 41
Download and view the complete annual report
Please find page 41 of the 2014 BB&T annual report below. You can navigate through the pages in the report by either clicking on the pages listed below, or by using the keyword search tool below to find specific information within the annual report.-
 1
1 -
2
-
3
-
4
-
5
-
6
-
7
-
8
-
9
-
10
-
11
-
12
-
13
-
14
-
15
-
16
-
17
-
18
-
19
-
20
-
21
-
22
-
23
-
24
-
25
-
26
-
27
-
28
-
29
-
30
-
 31
31 -
 32
32 -
 33
33 -
 34
34 -
 35
35 -
 36
36 -
 37
37 -
 38
38 -
 39
39 -
 40
40 -
 41
41 -
 42
42 -
 43
43 -
 44
44 -
 45
45 -
 46
46 -
 47
47 -
 48
48 -
 49
49 -
 50
50 -
 51
51 -
52
-
53
-
54
-
55
-
56
-
57
-
58
-
59
-
60
-
61
-
62
-
63
-
64
-
65
-
66
-
67
-
68
-
69
-
70
-
71
-
72
-
73
-
74
-
75
-
76
-
77
-
78
-
79
-
80
-
81
-
82
-
83
-
84
-
85
-
86
-
87
-
88
-
89
-
90
-
91
-
92
-
93
-
94
-
95
-
96
-
97
-
98
-
99
-
100
-
101
-
102
-
103
-
104
-
105
-
106
-
107
-
108
-
109
-
110
-
111
-
112
-
113
-
114
-
115
-
116
-
117
-
118
-
119
-
120
-
121
-
122
-
123
-
124
-
125
-
126
-
127
-
128
-
129
-
130
-
131
-
132
-
133
-
134
-
135
-
136
-
137
-
138
-
139
-
140
-
141
-
142
-
143
-
144
-
145
-
146
-
147
-
148
-
149
-
150
-
151
-
152
-
153
-
154
-
155
-
156
-
157
-
158
-
159
-
160
-
161
-
162
-
163
-
164
 |
 |

Table of Contents
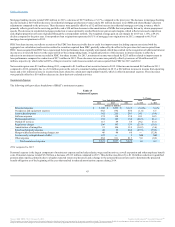
Total securities, at amortized cost: (2)
U.S. Treasuries $ 1,969 $ 486 $ 272 1.51 % 0.42 % 0.22 % $ 30 $ 2 $ 1 $ 28 $ 13 $ 15 $ 1 $ ― $ 1
GSEs 5,516 5,032 1,329 2.10 2.04 1.92 116 103 25 13 3 10 78 2 76
MBS issued by GSE 29,504 27,598 30,848 2.00 2.00 2.02 589 552 624 37 ― 37 (72) (6) (66)
States and political subdivisions 1,827 1,836 1,851 5.78 5.80 5.83 106 107 108 (1) ― (1) (1) (1) ―
Non-agency MBS 246 283 346 7.55 5.69 5.76 19 16 20 3 5 (2) (4) ― (4)
Other 547 470 505 1.43 1.45 1.65 8 7 8 1 ― 1 (1) ― (1)
Acquired from FDIC 932 1,067 1,183 13.35 12.82 14.53 125 137 172 (12) 5 (17) (35) (19) (16)
Total securities 40,541 36,772 36,334 2.45 2.51 2.64 993 924 958 69 26 43 (34) (24) (10)
Other earning assets (3) 1,881 2,412 3,359 2.13 1.39 0.91 40 34 31 6 15 (9) 3 13 (10)
Loans and leases, net of unearned income: (4)(5)
Commercial:
Commercial and industrial 39,537 38,206 36,966 3.35 3.63 3.96 1,325 1,386 1,464 (61) (108) 47 (78) (126) 48
CRE-income producing properties 10,489 9,916 9,046 3.49 3.72 3.82 366 368 346 (2) (23) 21 22 (9) 31
CRE-construction and development 2,616 2,589 3,398 3.51 3.86 3.76 92 100 128 (8) (9) 1 (28) 5 (33)
Direct retail lending (6) 8,249 15,952 15,270 4.10 4.64 4.87 338 741 744 (403) (78) (325) (3) (35) 32
Sales finance 10,007 8,658 7,680 2.71 3.18 3.97 271 275 305 (4) (44) 40 (30) (66) 36
Revolving credit 2,385 2,303 2,217 8.70 8.56 8.41 208 197 186 11 3 8 11 3 8
Residential mortgage (6) 31,528 23,598 22,623 4.20 4.22 4.37 1,325 996 989 329 (5) 334 7 (35) 42
Other lending subsidiaries 10,848 10,468 9,525 9.08 10.20 11.04 985 1,068 1,051 (83) (121) 38 17 (83) 100
Total loans and leases held for investment
(excluding acquired from FDIC) 115,659 111,690 106,725 4.25 4.59 4.88 4,910 5,131 5,213 (221) (385) 164 (82) (346) 264
Acquired from FDIC 1,613 2,667 4,045 17.22 16.93 18.91 278 451 765 (173) 8 (181) (314) (74) (240)
Total loans and leases held for investment 117,272 114,357 110,770 4.42 4.88 5.40 5,188 5,582 5,978 (394) (377) (17) (396) (420) 24
LHFS 1,558 3,170 2,963 4.19 3.59 3.42 65 114 101 (49) 17 (66) 13 5 8
Total loans and leases 118,830 117,527 113,733 4.42 4.85 5.35 5,253 5,696 6,079 (443) (360) (83) (383) (415) 32
Total earning assets 161,252 156,711 153,426 3.90 4.25 4.61 6,286 6,654 7,068 (368) (319) (49) (414) (426) 12
Nonearning assets 23,816 24,551 25,208
Total assets $ 185,068 $ 181,262 $ 178,634
Interest-bearing deposits:
Interest-checking $ 18,731 $ 19,305 $ 19,904 0.07 0.08 0.12 13 15 25 (2) (2) ― (10) (9) (1)
Money market and savings 49,728 48,640 46,927 0.15 0.13 0.18 74 64 85 10 9 1 (21) (24) 3
Time deposits and IRAs 22,569 26,006 31,647 0.67 0.85 1.01 151 221 319 (70) (43) (27) (98) (46) (52)
Foreign office deposits - interest-bearing 722 672 214 0.07 0.08 0.11 1 1 ― ― ― ― 1 ― 1
Total interest-bearing deposits 91,750 94,623 98,692 0.26 0.32 0.43 239 301 429 (62) (36) (26) (128) (79) (49)
Short-term borrowings 3,421 4,459 3,408 0.13 0.16 0.26 5 7 9 (2) (1) (1) (2) (4) 2
Long-term debt 22,210 19,301 20,651 2.36 3.03 3.02 525 584 624 (59) (139) 80 (40) 2 (42)
Total interest-bearing liabilities 117,381 118,383 122,751 0.65 0.75 0.86 769 892 1,062 (123) (176) 53 (170) (81) (89)
Noninterest-bearing deposits 37,327 33,932 28,925
Other liabilities 6,369 7,057 7,481
Shareholders’ equity 23,991 21,890 19,477
Total liabilities and shareholders’ equity $ 185,068 $ 181,262 $ 178,634
Average interest rate spread 3.25 % 3.50 % 3.75 %
NIM/ net interest income 3.42 % 3.68 % 3.91 % $ 5,517 $ 5,762 $ 6,006 $ (245) $ (143) $ (102) $ (244) $ (345) $ 101
Taxable-equivalent adjustment $ 143 $ 146 $ 149
(1) Yields are stated on a taxable equivalent basis assuming tax rates in effect for the periods presented.
(2) Total securities include AFS and HTM securities.
(3) Includes Federal funds sold, securities purchased under resale agreements or similar arrangements, interest-bearing deposits with banks, trading securities, FHLB stock and other earning assets.
(4) Loan fees, which are not material for any of the periods shown, have been included for rate calculation purposes.
(5) Nonaccrual loans have been included in the average balances.
(6) During the first quarter of 2014, $8.3 billion in loans were transferred from direct retail lending to residential mortgage.
(7) Excludes basis adjustments for fair value hedges.
40
Source: BB&T CORP, 10-K, February 25, 2015 Powered by Morningstar® Document Research℠
The information contained herein may not be copied, adapted or distributed and is not warranted to be accurate, complete or timely. The user assumes all risks for any damages or losses arising from any use of this information,
except to the extent such damages or losses cannot be limited or excluded by applicable law. Past financial performance is no guarantee of future results.