BB&T 2014 Annual Report Download - page 54
Download and view the complete annual report
Please find page 54 of the 2014 BB&T annual report below. You can navigate through the pages in the report by either clicking on the pages listed below, or by using the keyword search tool below to find specific information within the annual report.-
 1
1 -
2
-
3
-
4
-
5
-
6
-
7
-
8
-
9
-
10
-
11
-
12
-
13
-
14
-
15
-
16
-
17
-
18
-
19
-
20
-
21
-
22
-
23
-
24
-
25
-
26
-
27
-
28
-
29
-
30
-
31
-
32
-
33
-
34
-
35
-
36
-
37
-
38
-
39
-
40
-
41
-
42
-
43
-
 44
44 -
 45
45 -
 46
46 -
 47
47 -
 48
48 -
 49
49 -
 50
50 -
 51
51 -
 52
52 -
 53
53 -
 54
54 -
 55
55 -
 56
56 -
 57
57 -
 58
58 -
 59
59 -
 60
60 -
 61
61 -
 62
62 -
 63
63 -
 64
64 -
65
-
66
-
67
-
68
-
69
-
70
-
71
-
72
-
73
-
74
-
75
-
76
-
77
-
78
-
79
-
80
-
81
-
82
-
83
-
84
-
85
-
86
-
87
-
88
-
89
-
90
-
91
-
92
-
93
-
94
-
95
-
96
-
97
-
98
-
99
-
100
-
101
-
102
-
103
-
104
-
105
-
106
-
107
-
108
-
109
-
110
-
111
-
112
-
113
-
114
-
115
-
116
-
117
-
118
-
119
-
120
-
121
-
122
-
123
-
124
-
125
-
126
-
127
-
128
-
129
-
130
-
131
-
132
-
133
-
134
-
135
-
136
-
137
-
138
-
139
-
140
-
141
-
142
-
143
-
144
-
145
-
146
-
147
-
148
-
149
-
150
-
151
-
152
-
153
-
154
-
155
-
156
-
157
-
158
-
159
-
160
-
161
-
162
-
163
-
164
 |
 |

Table of Contents
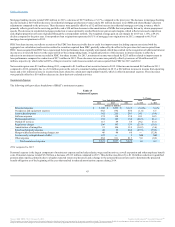
Lending Activities
The primary goal of the BB&T lending function is to help clients achieve their financial goals by providing quality loan products that are fair to the client
and profitable to the Company. Management believes that this purpose can best be accomplished by building strong, profitable client relationships over
time, with BB&T becoming an important contributor to the prosperity and well-being of its clients. In addition to the importance placed on client knowledge
and continuous involvement with clients, BB&T’s lending process incorporates the standards of a consistent company-wide credit culture and an in-depth
local market knowledge. Furthermore, the Company employs strict underwriting criteria governing the degree of assumed risk and the diversity of the loan
portfolio in terms of type, industry and geographical concentration. In this context, BB&T strives to meet the credit needs of businesses and consumers in its
markets while pursuing a balanced strategy of loan profitability, loan growth and loan quality.
Commercial:
Commercial and industrial $ 40,383 $ 39,906 $ 39,397 $ 38,435 $ 38,101
CRE - income producing properties 10,681 10,596 10,382 10,293 10,031
CRE - construction and development 2,772 2,670 2,566 2,454 2,433
Direct retail lending (1) 8,085 7,912 7,666 9,349 15,998
Sales finance 10,247 10,313 10,028 9,428 9,262
Revolving credit 2,427 2,396 2,362 2,357 2,357
Residential mortgage (1) 31,046 32,000 32,421 30,635 23,979
Other lending subsidiaries 11,351 11,234 10,553 10,236 10,448
Total average loans and leases held for
investment (excluding acquired from FDIC) 116,992 117,027 115,375 113,187 112,609
Acquired from FDIC 1,309 1,537 1,739 1,874 2,186
Total average loans and leases held
for investment 118,301 118,564 117,114 115,061 114,795
LHFS 1,611 1,907 1,396 1,311 2,206
Total average loans and leases $ 119,912 $ 120,471 $ 118,510 $ 116,372 $ 117,001
(1) During the first quarter of 2014, $8.3 billion of loans were transferred from direct retail lending to residential mortgage.
Average loans held for investment for the fourth quarter of 2014 were $118.3 billion, down $263 million compared to the prior quarter. The decrease in
average loans held for investment was primarily due to a decline of $954 million in the residential mortgage portfolio and continued run-off of loans
acquired from the FDIC. These declines were partially offset by a $477 million increase in the commercial and industrial portfolio as well as smaller increases
in the CRE – construction and development, direct retail lending and other lending subsidiaries portfolios.
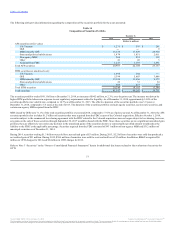
The decrease of $954 million, or 11.8% annualized, in the residential mortgage portfolio reflects the $550 million loan sale that occurred during the third
quarter, which had a partial impact on third quarter averages and a full impact on fourth quarter averages. The decrease also reflects lower origination volume
and a reduction in fixed rate home equity loans due to continued runoff. The previously described $140 million loan sale occurred late in the fourth quarter
and therefore had minimal impact on average balances.
Average commercial and industrial loans increased $477 million, or 4.7% annualized, which reflects strong growth from large corporate clients. Growth in
this sector has benefited from the expansion of BB&T’s footprint into new markets. CRE – construction and development loans were up 15.2% annualized,
reflecting a continued strong growth trend in that portfolio.
The average direct retail lending portfolio increased $173 million, or 8.7% annualized, while average other lending subsidiaries loans increased $117
million, or 4.1% on an annualized basis.
53
Source: BB&T CORP, 10-K, February 25, 2015 Powered by Morningstar® Document Research℠
The information contained herein may not be copied, adapted or distributed and is not warranted to be accurate, complete or timely. The user assumes all risks for any damages or losses arising from any use of this information,
except to the extent such damages or losses cannot be limited or excluded by applicable law. Past financial performance is no guarantee of future results.