BB&T 2014 Annual Report Download - page 35
Download and view the complete annual report
Please find page 35 of the 2014 BB&T annual report below. You can navigate through the pages in the report by either clicking on the pages listed below, or by using the keyword search tool below to find specific information within the annual report.-
 1
1 -
2
-
3
-
4
-
5
-
6
-
7
-
8
-
9
-
10
-
11
-
12
-
13
-
14
-
15
-
16
-
17
-
18
-
19
-
20
-
21
-
22
-
23
-
24
-
 25
25 -
 26
26 -
 27
27 -
 28
28 -
 29
29 -
 30
30 -
 31
31 -
 32
32 -
 33
33 -
 34
34 -
 35
35 -
 36
36 -
 37
37 -
 38
38 -
 39
39 -
 40
40 -
 41
41 -
 42
42 -
 43
43 -
 44
44 -
 45
45 -
46
-
47
-
48
-
49
-
50
-
51
-
52
-
53
-
54
-
55
-
56
-
57
-
58
-
59
-
60
-
61
-
62
-
63
-
64
-
65
-
66
-
67
-
68
-
69
-
70
-
71
-
72
-
73
-
74
-
75
-
76
-
77
-
78
-
79
-
80
-
81
-
82
-
83
-
84
-
85
-
86
-
87
-
88
-
89
-
90
-
91
-
92
-
93
-
94
-
95
-
96
-
97
-
98
-
99
-
100
-
101
-
102
-
103
-
104
-
105
-
106
-
107
-
108
-
109
-
110
-
111
-
112
-
113
-
114
-
115
-
116
-
117
-
118
-
119
-
120
-
121
-
122
-
123
-
124
-
125
-
126
-
127
-
128
-
129
-
130
-
131
-
132
-
133
-
134
-
135
-
136
-
137
-
138
-
139
-
140
-
141
-
142
-
143
-
144
-
145
-
146
-
147
-
148
-
149
-
150
-
151
-
152
-
153
-
154
-
155
-
156
-
157
-
158
-
159
-
160
-
161
-
162
-
163
-
164
 |
 |

Table of Contents
·Global economic and geopolitical risk, including potential financial system instability and ramifications of sovereign debt issues.
·Cost and risk associated with regulatory reform and initiatives and IT projects.
·Merger integration risk.
In addition, certain other challenges and unforeseen events could have a near term impact on BB&T’s financial condition and results of operations. See the
section titled “Forward-Looking Statements” for additional examples of such challenges.
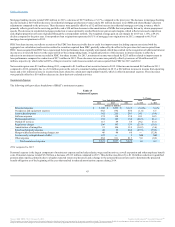
Overview of Significant Events and Financial Results
BB&T generated strong operating results for 2014, despite the challenges associated with the continued low interest rate environment, increased costs
associated with certain regulatory initiatives and intense competition for loans to qualified borrowers. From a NIM perspective, the negative impact
associated with lower yields on new loans and securities was partially mitigated by a decrease in funding costs from 0.75% to 0.65%, primarily driven by a
decline in the cost of interest-bearing deposits and the early extinguishment of certain FHLB advances during the third quarter of 2014.
Consolidated net income available to common shareholders for 2014 totaled $2.0 billion, an increase of $441 million compared to $1.6 billion earned during
2013. On a diluted per common share basis, earnings for 2014 were $2.75, compared to $2.19 for 2013. Earnings for 2013 were reduced by $516 million of
tax adjustments. BB&T’s results of operations for 2014 produced a return on average assets of 1.20% and a return on average common shareholders’ equity of
9.40% compared to prior year ratios of 0.95% and 8.06%, respectively.
BB&T’s revenues for 2014 were $9.3 billion on a FTE basis, a decrease of $398 million compared to 2013. Net interest income on a FTE basis was $245
million lower than the prior year, which reflects a $368 million decrease in interest income that was partially offset by a decrease in funding costs totaling
$123 million. Noninterest income decreased $153 million for the year, driven by a $170 million decline in mortgage banking income, which reflects a
decline in the volume of residential mortgage loan production and sales and tighter margins.
The provision for credit losses declined $341 million, or 57.6%, compared to the prior year, reflecting continued improvement in credit quality. The
provision for credit losses also benefited from loan sales that generated a combined $66 million in gains through the release of the related ALLL.
Asset quality improved significantly during 2014 as NPAs declined $392 million, or 33.4%, compared to 2013. This decline included a $319 million
decrease in NPLs, partially due to loan sales, and a $73 million decrease in foreclosed real estate and other property. Net charge-offs for 2014 were $538
million, compared to $792 million for the prior year. The ratio of the ALLL to net charge-offs was 2.74x for 2014, compared to 2.19x in 2013.
Noninterest expense increased $84 million primarily due to a $122 million loss on early extinguishment of debt and $118 million in charges related to the
FHA-insured loan origination process. These increases were partially offset by a $113 million decrease in personnel expense primarily due to reduced
pension expense.
Effective October 1, 2014, loans and securities subject to the commercial loss sharing agreement with the FDIC related to the Colonial acquisition were no
longer covered by loss sharing. At December 31, 2014, these loans had a carrying value of $561 million and a UPB of $836 million, and the securities had a
carrying value of $1.2 billion.
BB&T’s total assets at December 31, 2014 were $186.8 billion, an increase of $3.8 billion compared to December 31, 2013. This increase includes a $4.2
billion increase in loans and leases due to broad-based loan growth, with commercial and industrial up $2.9 billion, sales finance up $1.2 billion and other
lending subsidiaries up $1.0 billion. A decline in direct retail lending balances and a corresponding increase in residential mortgage balances reflect the
impact of an $8.3 billion transfer that occurred during the first quarter of 2014. Excluding this transfer, mortgage balances declined due to the previously
mentioned loan sales, lower origination volume and management’s decision to sell substantially all conforming mortgage loan production. HTM securities
increased $2.1 billion, while AFS securities declined $1.2 billion. Other assets declined $1.4 billion due to a $309 million decrease in the FDIC loss share
receivable and a $1.0 billion decline in commercial factoring balances.
34
Source: BB&T CORP, 10-K, February 25, 2015 Powered by Morningstar® Document Research℠
The information contained herein may not be copied, adapted or distributed and is not warranted to be accurate, complete or timely. The user assumes all risks for any damages or losses arising from any use of this information,
except to the extent such damages or losses cannot be limited or excluded by applicable law. Past financial performance is no guarantee of future results.