BB&T 2014 Annual Report Download - page 111
Download and view the complete annual report
Please find page 111 of the 2014 BB&T annual report below. You can navigate through the pages in the report by either clicking on the pages listed below, or by using the keyword search tool below to find specific information within the annual report.-
 1
1 -
2
-
3
-
4
-
5
-
6
-
7
-
8
-
9
-
10
-
11
-
12
-
13
-
14
-
15
-
16
-
17
-
18
-
19
-
20
-
21
-
22
-
23
-
24
-
25
-
26
-
27
-
28
-
29
-
30
-
31
-
32
-
33
-
34
-
35
-
36
-
37
-
38
-
39
-
40
-
41
-
42
-
43
-
44
-
45
-
46
-
47
-
48
-
49
-
50
-
51
-
52
-
53
-
54
-
55
-
56
-
57
-
58
-
59
-
60
-
61
-
62
-
63
-
64
-
65
-
66
-
67
-
68
-
69
-
70
-
71
-
72
-
73
-
74
-
75
-
76
-
77
-
78
-
79
-
80
-
81
-
82
-
83
-
84
-
85
-
86
-
87
-
88
-
89
-
90
-
91
-
92
-
93
-
94
-
95
-
96
-
97
-
98
-
99
-
100
-
 101
101 -
 102
102 -
 103
103 -
 104
104 -
 105
105 -
 106
106 -
 107
107 -
 108
108 -
 109
109 -
 110
110 -
 111
111 -
 112
112 -
 113
113 -
 114
114 -
 115
115 -
 116
116 -
 117
117 -
 118
118 -
 119
119 -
 120
120 -
 121
121 -
122
-
123
-
124
-
125
-
126
-
127
-
128
-
129
-
130
-
131
-
132
-
133
-
134
-
135
-
136
-
137
-
138
-
139
-
140
-
141
-
142
-
143
-
144
-
145
-
146
-
147
-
148
-
149
-
150
-
151
-
152
-
153
-
154
-
155
-
156
-
157
-
158
-
159
-
160
-
161
-
162
-
163
-
164
 |
 |

Table of Contents
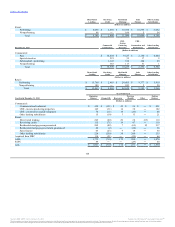
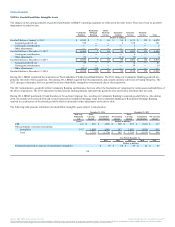
The following table provides a summary of loans that are collectively evaluated for impairment.
Commercial:
Commercial and industrial $ 41,120 $ 379 $ 38,042 $ 382
CRE - income producing properties 10,583 147 10,033 128
CRE - construction and development 2,670 39 2,289 60
Other lending subsidiaries 5,351 20 4,501 15
Retail:
Direct retail lending 8,048 86 15,648 166
Revolving credit 2,419 94 2,355 96
Residential mortgage-nonguaranteed 29,660 181 22,557 160
Residential mortgage-government guaranteed 622 4 759 7
Sales finance 10,579 46 9,363 41
Other lending subsidiaries 5,930 204 5,823 196
Acquired from FDIC 1,215 64 2,035 114
Total $ 118,197 $ 1,264 $ 113,405 $ 1,365
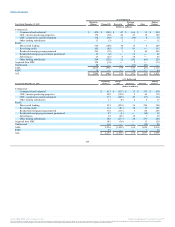
The following tables set forth certain information regarding impaired loans, excluding purchased impaired loans and LHFS, that were individually evaluated
for reserves.
With no related ALLL recorded:
Commercial:
Commercial and industrial $ 87 $ 136 $ ― $ 138 $ 2
CRE - income producing properties 18 25 ― 36 ―
CRE - construction and development 14 21 ― 20 ―
Other lending subsidiaries ― 1 ― ― ―
Retail:
Direct retail lending 13 49 ― 14 1
Residential mortgage-nonguaranteed 87 141 ― 147 5
Residential mortgage-government guaranteed 3 4 ― 7 ―
Sales finance 1 2 ― 1 ―
Other lending subsidiaries 3 7 ― 3 ―
With an ALLL recorded:
Commercial:
Commercial and industrial 247 254 42 279 5
CRE - income producing properties 121 123 15 133 4
CRE - construction and development 51 52 9 65 2
Other lending subsidiaries 5 5 1 4 ―
Retail:
Direct retail lending 85 87 24 95 5
Revolving credit 41 41 16 45 2
Residential mortgage-nonguaranteed 360 370 36 700 31
Residential mortgage-government guaranteed 358 358 32 402 17
Sales finance 20 21 4 20 1
Other lending subsidiaries 173 175 31 148 22
Total $ 1,687 $ 1,872 $ 210 $ 2,257 $ 97
110
Source: BB&T CORP, 10-K, February 25, 2015 Powered by Morningstar® Document Research℠
The information contained herein may not be copied, adapted or distributed and is not warranted to be accurate, complete or timely. The user assumes all risks for any damages or losses arising from any use of this information,
except to the extent such damages or losses cannot be limited or excluded by applicable law. Past financial performance is no guarantee of future results.