BB&T 2014 Annual Report Download - page 37
Download and view the complete annual report
Please find page 37 of the 2014 BB&T annual report below. You can navigate through the pages in the report by either clicking on the pages listed below, or by using the keyword search tool below to find specific information within the annual report.-
 1
1 -
2
-
3
-
4
-
5
-
6
-
7
-
8
-
9
-
10
-
11
-
12
-
13
-
14
-
15
-
16
-
17
-
18
-
19
-
20
-
21
-
22
-
23
-
24
-
25
-
26
-
 27
27 -
 28
28 -
 29
29 -
 30
30 -
 31
31 -
 32
32 -
 33
33 -
 34
34 -
 35
35 -
 36
36 -
 37
37 -
 38
38 -
 39
39 -
 40
40 -
 41
41 -
 42
42 -
 43
43 -
 44
44 -
 45
45 -
 46
46 -
 47
47 -
48
-
49
-
50
-
51
-
52
-
53
-
54
-
55
-
56
-
57
-
58
-
59
-
60
-
61
-
62
-
63
-
64
-
65
-
66
-
67
-
68
-
69
-
70
-
71
-
72
-
73
-
74
-
75
-
76
-
77
-
78
-
79
-
80
-
81
-
82
-
83
-
84
-
85
-
86
-
87
-
88
-
89
-
90
-
91
-
92
-
93
-
94
-
95
-
96
-
97
-
98
-
99
-
100
-
101
-
102
-
103
-
104
-
105
-
106
-
107
-
108
-
109
-
110
-
111
-
112
-
113
-
114
-
115
-
116
-
117
-
118
-
119
-
120
-
121
-
122
-
123
-
124
-
125
-
126
-
127
-
128
-
129
-
130
-
131
-
132
-
133
-
134
-
135
-
136
-
137
-
138
-
139
-
140
-
141
-
142
-
143
-
144
-
145
-
146
-
147
-
148
-
149
-
150
-
151
-
152
-
153
-
154
-
155
-
156
-
157
-
158
-
159
-
160
-
161
-
162
-
163
-
164
 |
 |

Table of Contents
The FTE-adjusted NIM is the primary measure used in evaluating the gross profit margin from the portfolios of earning assets. The FTE-adjusted NIM was
3.68% in 2013 compared with 3.91% in 2012. The decline in the NIM primarily reflects lower yields on new loans and securities and runoff of loans acquired
from the FDIC, partially offset by the lower funding costs described above. The average annualized FTE yield for total loans and leases was 4.85% for 2013,
compared to 5.35% for the prior year. The decrease was primarily due to lower yields on new loan originations and the runoff of higher yielding loans
acquired from FDIC. The FTE yield on the total securities portfolio was 2.51% for the year ended December 31, 2013, compared to 2.64% for the prior year.
This decrease reflects runoff in the security portfolio acquired from FDIC and security duration adjustments.
The average rate paid on interest-bearing deposits dropped to 0.32% during 2013, from 0.43% in 2012. This improvement included a 16 basis point
reduction in the cost of time deposits and IRAs and a five basis point reduction in the cost of money market and savings accounts.
The rates paid on average short-term borrowings declined from 0.26% in 2012 to 0.16% during 2013. At December 31, 2013, the targeted Federal funds rate
was a range of zero percent to 0.25%. The average rate on long-term debt during 2013 was 3.03%, an increase of one basis point compared to the prior year.
This increase reflects the redemption of all higher cost junior subordinated debt to unconsolidated trusts and the related benefit associated with accelerated
amortization of derivatives that were unwound in a gain position during 2012, partially offset by lower effective rates on new debt issued during 2013.
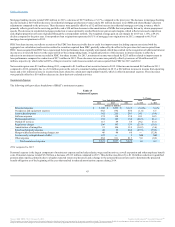
Acquired from the FDIC and FDIC Loss Share Receivable/Payable
In connection with the Colonial acquisition, Branch Bank entered into loss sharing agreements with the FDIC that outline the terms and conditions under
which the FDIC will reimburse Branch Bank for a portion of the losses incurred on certain loans, OREO, investment securities and other assets. The FDIC’s
obligation to reimburse Branch Bank for losses with respect to assets acquired from the FDIC began with the first dollar of loss incurred.
Loans and leases (2) $ 561 $ 654 $ 1,215
AFS securities 1,243 ― 1,243
Other assets 58 38 96
Total assets acquired from the FDIC $ 1,862 $ 692 $ 2,554
(1) The loss sharing provisions of the commercial loss sharing agreement have expired; however, gains on the disposition of assets subject to this agreement
will be shared with the FDIC through September 30, 2017.
(2) Loans and leases subject to the commercial and single family loss share agreements had a UPB of $836 million and $888 million, respectively.
Assets subject to the single family loss sharing agreement are indemnified through August 31, 2019.
As of October 1, 2014, the loss sharing provisions of the commercial loss sharing agreement expired. As a result, losses on the assets subject to this agreement
(commercial loans, other related assets and certain AFS securities) are no longer shared with the FDIC. However, gains on the disposition of assets subject to
this agreement will be shared with the FDIC through September 30, 2017. Any gains realized after September 30, 2017 would not be shared with the FDIC.
The gain/loss sharing coverage related to the acquired AFS securities is based on a contractually-specified value of the securities as of the date of the loss
sharing agreement, adjusted to reflect subsequent pay-downs, redemptions or maturities on the underlying securities. The contractually-specified value of
these securities totaled approximately $626 million at December 31, 2014. During the period of gain sharing (October 1, 2014 through September 30, 2017),
any decline in the fair value of the acquired AFS securities down to the contractually-specified value would reduce BB&T’s liability to the FDIC at the
applicable loss sharing percentage. BB&T is not indemnified for declines in the fair value of the acquired securities below the contractually-specified
amount.
36
Source: BB&T CORP, 10-K, February 25, 2015 Powered by Morningstar® Document Research℠
The information contained herein may not be copied, adapted or distributed and is not warranted to be accurate, complete or timely. The user assumes all risks for any damages or losses arising from any use of this information,
except to the extent such damages or losses cannot be limited or excluded by applicable law. Past financial performance is no guarantee of future results.