BB&T 2014 Annual Report Download - page 47
Download and view the complete annual report
Please find page 47 of the 2014 BB&T annual report below. You can navigate through the pages in the report by either clicking on the pages listed below, or by using the keyword search tool below to find specific information within the annual report.-
 1
1 -
2
-
3
-
4
-
5
-
6
-
7
-
8
-
9
-
10
-
11
-
12
-
13
-
14
-
15
-
16
-
17
-
18
-
19
-
20
-
21
-
22
-
23
-
24
-
25
-
26
-
27
-
28
-
29
-
30
-
31
-
32
-
33
-
34
-
35
-
36
-
 37
37 -
 38
38 -
 39
39 -
 40
40 -
 41
41 -
 42
42 -
 43
43 -
 44
44 -
 45
45 -
 46
46 -
 47
47 -
 48
48 -
 49
49 -
 50
50 -
 51
51 -
 52
52 -
 53
53 -
 54
54 -
 55
55 -
 56
56 -
 57
57 -
58
-
59
-
60
-
61
-
62
-
63
-
64
-
65
-
66
-
67
-
68
-
69
-
70
-
71
-
72
-
73
-
74
-
75
-
76
-
77
-
78
-
79
-
80
-
81
-
82
-
83
-
84
-
85
-
86
-
87
-
88
-
89
-
90
-
91
-
92
-
93
-
94
-
95
-
96
-
97
-
98
-
99
-
100
-
101
-
102
-
103
-
104
-
105
-
106
-
107
-
108
-
109
-
110
-
111
-
112
-
113
-
114
-
115
-
116
-
117
-
118
-
119
-
120
-
121
-
122
-
123
-
124
-
125
-
126
-
127
-
128
-
129
-
130
-
131
-
132
-
133
-
134
-
135
-
136
-
137
-
138
-
139
-
140
-
141
-
142
-
143
-
144
-
145
-
146
-
147
-
148
-
149
-
150
-
151
-
152
-
153
-
154
-
155
-
156
-
157
-
158
-
159
-
160
-
161
-
162
-
163
-
164
 |
 |

Table of Contents
During 2014, BB&T also announced that it reached agreements to acquire additional branches in Texas, The Bank of Kentucky Financial Corporation, and
Susquehanna Bancshares, Inc.
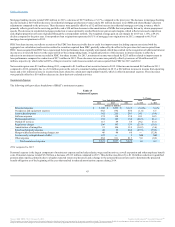
Residential Mortgage Banking
Residential Mortgage Banking net income was $204 million in 2014, a decrease of $179 million, or 46.7%, compared to 2013.
Mortgage originations totaled $17.4 billion in 2014, a decrease of $14.2 billion compared to $31.6 billion in 2013. BB&T’s residential mortgage servicing
portfolio, which includes both retained loans and loans serviced for others, totaled $122.3 billion at the end of 2014, compared to $121.2 billion at
December 31, 2013.
Segment net interest income decreased $87 million to $498 million, primarily the result of lower average loan balances.
The allocated provision for credit losses was a benefit of $107 million in 2014, compared to expense of $12 million in 2013, reflecting the benefit of the
previously discussed sales of residential mortgages in the third and fourth quarters of 2014 and a decrease in loan balances consistent with the current
strategy of selling substantially all conforming mortgage loan production.
Noninterest income decreased $174 million driven by lower gains on residential mortgage loan production and sales due to lower origination volume and
tighter pricing due to competitive factors. This decrease was partially offset by an increase in net servicing income of $31 million, primarily due to slower
prepayment speeds and a $2.8 billion, or 3.2%, increase in the investor-owned servicing portfolio.
Noninterest expense increased $134 million, which primarily reflects a $27 million charge in the fourth quarter of 2014 related to the previously discussed
ongoing review of mortgage processes, as well as adjustments in the second quarter of 2014 totaling $118 million related to the previously described FHA-
insured loan exposures.
The provision for income taxes decreased $111 million, primarily due to lower pre-tax income.
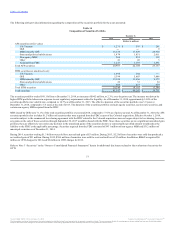
Dealer Financial Services
Dealer Financial Services net income was $183 million in 2014, a decrease of $21 million, or 10.3%, compared to 2013.
The allocated provision for credit losses increased $23 million primarily due to higher charge-offs in the nonprime automobile loan portfolio as credit trends
in that portfolio continue to normalize.
Noninterest expense increased $8 million, driven by higher personnel expense, primarily related to Regional Acceptance Corporation’s geographic
expansion and operating charge-offs.
Dealer Financial Services grew average loans by $1.1 billion, or 10.5%, compared to 2013 as the result of strong growth in the prime and nonprime auto
lending businesses.
Specialized Lending
Specialized Lending net income was $254 million in 2014, a decrease of $16 million, or 5.9%, compared to 2013.
Segment net interest income decreased $120 million to $432 million, which primarily reflects the sale of a consumer lending subsidiary during the fourth
quarter of 2013 and lower credit spreads on loans earned during 2014.
The sale of the specialized lending subsidiary also had a beneficial impact on the allocated provision for credit losses, which decreased $46 million.
Noninterest income increased $10 million driven by higher operating lease income.
Noninterest expense decreased $36 million driven by lower personnel, occupancy and equipment, loan processing and professional services expense.
Small ticket consumer finance, equipment finance, governmental finance and commercial mortgage experienced strong growth compared to 2013.
46
Source: BB&T CORP, 10-K, February 25, 2015 Powered by Morningstar® Document Research℠
The information contained herein may not be copied, adapted or distributed and is not warranted to be accurate, complete or timely. The user assumes all risks for any damages or losses arising from any use of this information,
except to the extent such damages or losses cannot be limited or excluded by applicable law. Past financial performance is no guarantee of future results.