BB&T 2014 Annual Report Download - page 42
Download and view the complete annual report
Please find page 42 of the 2014 BB&T annual report below. You can navigate through the pages in the report by either clicking on the pages listed below, or by using the keyword search tool below to find specific information within the annual report.-
 1
1 -
2
-
3
-
4
-
5
-
6
-
7
-
8
-
9
-
10
-
11
-
12
-
13
-
14
-
15
-
16
-
17
-
18
-
19
-
20
-
21
-
22
-
23
-
24
-
25
-
26
-
27
-
28
-
29
-
30
-
31
-
 32
32 -
 33
33 -
 34
34 -
 35
35 -
 36
36 -
 37
37 -
 38
38 -
 39
39 -
 40
40 -
 41
41 -
 42
42 -
 43
43 -
 44
44 -
 45
45 -
 46
46 -
 47
47 -
 48
48 -
 49
49 -
 50
50 -
 51
51 -
 52
52 -
53
-
54
-
55
-
56
-
57
-
58
-
59
-
60
-
61
-
62
-
63
-
64
-
65
-
66
-
67
-
68
-
69
-
70
-
71
-
72
-
73
-
74
-
75
-
76
-
77
-
78
-
79
-
80
-
81
-
82
-
83
-
84
-
85
-
86
-
87
-
88
-
89
-
90
-
91
-
92
-
93
-
94
-
95
-
96
-
97
-
98
-
99
-
100
-
101
-
102
-
103
-
104
-
105
-
106
-
107
-
108
-
109
-
110
-
111
-
112
-
113
-
114
-
115
-
116
-
117
-
118
-
119
-
120
-
121
-
122
-
123
-
124
-
125
-
126
-
127
-
128
-
129
-
130
-
131
-
132
-
133
-
134
-
135
-
136
-
137
-
138
-
139
-
140
-
141
-
142
-
143
-
144
-
145
-
146
-
147
-
148
-
149
-
150
-
151
-
152
-
153
-
154
-
155
-
156
-
157
-
158
-
159
-
160
-
161
-
162
-
163
-
164
 |
 |

Table of Contents
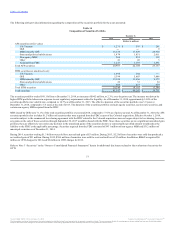
Provision for Credit Losses
2014 compared to 2013
The provision for credit losses was $251 million in 2014, a decrease of $341 million compared to the prior year. The decrease in the provision for credit
losses reflects continued improvement in credit trends and outlook, as net charge-offs in 2014 decreased 32.1% compared to the prior year. Improving credit
conditions also resulted in an increase in the ratio of the ALLL to net charge-offs, which increased to 2.74x for 2014, compared to 2.19x for 2013.
During 2014, approximately $550 million of residential mortgage loans that were primarily performing TDRs and approximately $140 million of residential
mortgage loans that were primarily nonperforming were sold at a pre-tax gain of $42 million and $24 million, respectively. Both of these gains were
recognized as a reduction to the provision for credit losses.
Net charge-offs were 0.46% of average loans and leases held for investment for 2014, compared to 0.69% of average loans and leases held for investment
during 2013. Net charge-offs declined $254 million, or 32.1%, with improvement across most loan portfolios led by commercial and industrial loans, which
declined $112 million compared to 2013. Net charge-offs in other lending subsidiaries were $15 million higher primarily due to a process change that
resulted in the accelerated recognition of charge-offs in the nonprime automobile lending portfolio.
2013 compared to 2012
The provision for credit losses was $592 million in 2013, a decrease of $465 million compared to the prior year. The decrease in the provision for credit
losses reflected continued improvement in credit trends and outlook, as net charge-offs in 2013 decreased 38.8% compared to the prior year. Improving credit
conditions also resulted in an increase in the ratio of the ALLL to net charge-offs, which increased to 2.19x for 2013, compared to 1.56x for 2012.
Net charge-offs were 0.69% of average loans and leases held for investment during 2013, compared to 1.17% of average loans and leases held for investment
during 2012. Net charge-offs decreased in nearly all loan portfolios, including significant decreases in the CRE-construction and development, CRE-income
producing properties and direct retail lending portfolios.
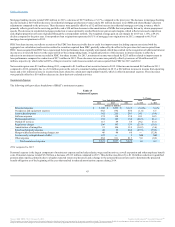
Noninterest Income
Noninterest income is a significant contributor to BB&T’s financial results. Management focuses on diversifying its sources of revenue to further reduce
BB&T’s reliance on traditional spread-based interest income, as certain fee-based activities are a relatively stable revenue source during periods of changing
interest rates.
Insurance income $ 1,643 $ 1,517 $ 1,359 8.3 % 11.6 %
Service charges on deposits 600 584 566 2.7 3.2
Mortgage banking income 395 565 840 (30.1) (32.7)
Investment banking and brokerage fees and commissions 387 383 365 1.0 4.9
Bankcard fees and merchant discounts 269 256 236 5.1 8.5
Trust and investment advisory revenues 221 200 184 10.5 8.7
Checkcard fees 203 199 185 2.0 7.6
Income from bank-owned life insurance 110 113 116 (2.7) (2.6)
FDIC loss share income, net (343) (293) (318) 17.1 (7.9)
Securities gains (losses), net (3) 51 (12) (105.9) NM
Other income 302 362 299 (16.6) 21.1
Total noninterest income $ 3,784 $ 3,937 $ 3,820 (3.9) 3.1
41
Source: BB&T CORP, 10-K, February 25, 2015 Powered by Morningstar® Document Research℠
The information contained herein may not be copied, adapted or distributed and is not warranted to be accurate, complete or timely. The user assumes all risks for any damages or losses arising from any use of this information,
except to the extent such damages or losses cannot be limited or excluded by applicable law. Past financial performance is no guarantee of future results.