Verizon Wireless 2011 Annual Report Download - page 2
Download and view the complete annual report
Please find page 2 of the 2011 Verizon Wireless annual report below. You can navigate through the pages in the report by either clicking on the pages listed below, or by using the keyword search tool below to find specific information within the annual report.-
 1
1 -
 2
2 -
 3
3 -
 4
4 -
 5
5 -
 6
6 -
 7
7 -
 8
8 -
 9
9 -
 10
10 -
 11
11 -
 12
12 -
 13
13 -
14
-
15
-
16
-
17
-
18
-
19
-
20
-
21
-
22
-
23
-
24
-
25
-
26
-
27
-
28
-
29
-
30
-
31
-
32
-
33
-
34
-
35
-
36
-
37
-
38
-
39
-
40
-
41
-
42
-
43
-
44
-
45
-
46
-
47
-
48
-
49
-
50
-
51
-
52
-
53
-
54
-
55
-
56
-
57
-
58
-
59
-
60
-
61
-
62
-
63
-
64
-
65
-
66
-
67
-
68
-
69
-
70
-
71
-
72
-
73
-
74
-
75
-
76
-
77
-
78
-
79
-
80
-
81
-
82
-
83
-
84
-
85
-
86
-
87
-
88
 |
 |
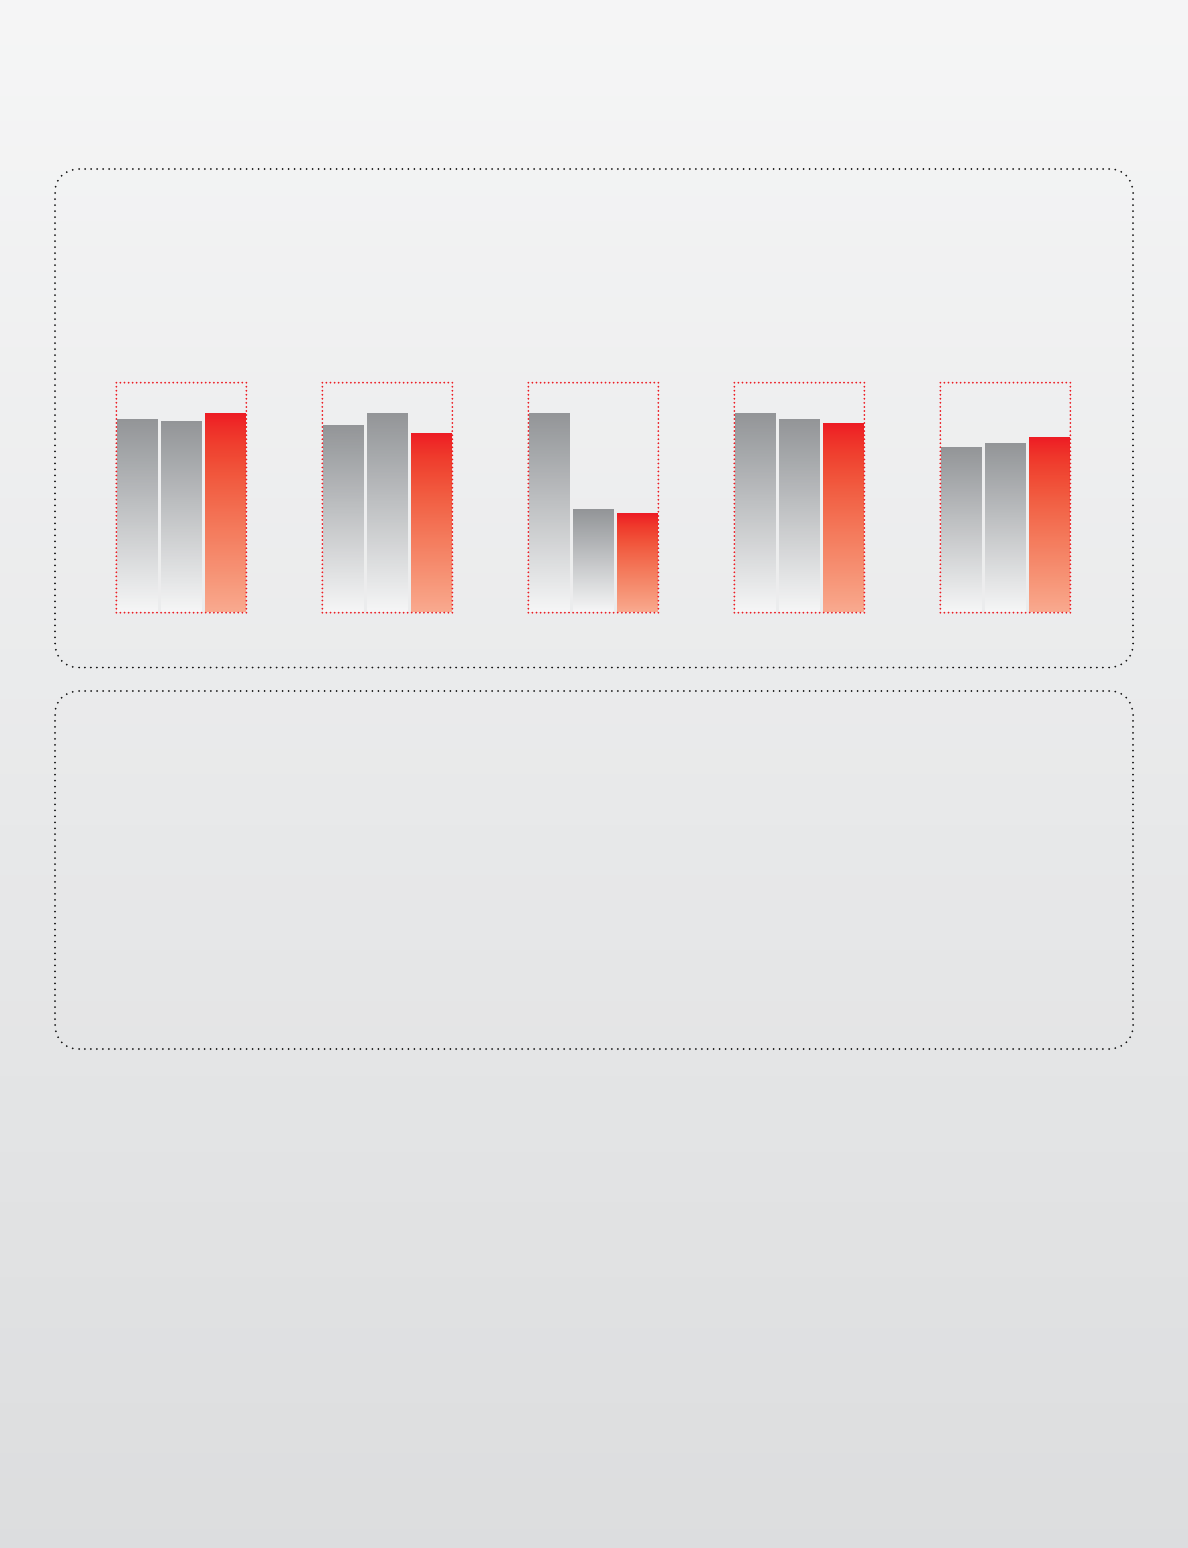
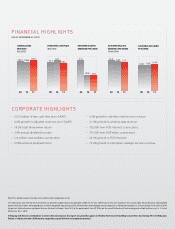
Financial HigHligHts
AS OF DECEMBER 31, 2011
$107.8 $106.6 $110.9 $31.4 $33.4
$29.8 $.
$. $.
DIVIDENDS DECLARED
PER SHARE
09 10 11
$2.26 $2.15$2.15
$2.20
ADJUSTED DILUTED
EARNINGS PER SHARE
(NON-GAAP)
09 10 11
$0.85
$1.72
$0.90
09 10 11
REPORTED DILUTED
EARNINGS PER SHARE
CONSOLIDATED
REVENUES
(BILLIONS)
OPERATING CASH FLOW
(BILLIONS)
09 10 1109 10 11
cORPORatE HigHligHts
• $13.5billioninfreecashflow(non-GAAP)
• 6.2%growthinadjustedrevenues(non-GAAP)
• 18.2%totalshareownerreturn
• 2.6%annualdividendincrease
• 5.4millionnewwirelessconnections
• 0.95%wirelesspostpaidchurn
• 6.3%growthinwirelessretailservicerevenue
• 21.0%growthinwirelessdatarevenue
• 735,000newFiOSInternetconnections
• 701,000newFiOSVideoconnections
• 20.1%growthinFiOSrevenue
• 15.2%growthinenterprisestrategicservicesrevenue
Note: Prior-period amounts have been reclassified to reflect comparable results.
See www.verizon.com/investor for reconciliations to generally accepted accounting principles (GAAP) for the non-GAAP financial measures included in this annual report. Reclassifications of prior period
amounts have been made, where appropriate, to reflect comparable operating results for the divestiture of overlapping wireless properties in 105 operating markets in 24 states during the first half of 2010;
the wireless deferred revenue adjustment that was disclosed in Verizon’s Form 10-Q for the period ended June 30, 2010; and the spinoff to Frontier of local exchange and related landline assets in 14 states,
effective on July 1, 2010.
In keeping with Verizon’s commitment to protect the environment, this report was printed on paper certified by the Forest Stewardship Council (FSC). By selecting FSC-certified paper,
Verizon is helping to make a difference by supporting responsible forest management practices.