Verizon Wireless 2011 Annual Report Download - page 36
Download and view the complete annual report
Please find page 36 of the 2011 Verizon Wireless annual report below. You can navigate through the pages in the report by either clicking on the pages listed below, or by using the keyword search tool below to find specific information within the annual report.-
 1
1 -
2
-
3
-
4
-
5
-
6
-
7
-
8
-
9
-
10
-
11
-
12
-
13
-
14
-
15
-
16
-
17
-
18
-
19
-
20
-
21
-
22
-
23
-
24
-
25
-
 26
26 -
 27
27 -
 28
28 -
 29
29 -
 30
30 -
 31
31 -
 32
32 -
 33
33 -
 34
34 -
 35
35 -
 36
36 -
 37
37 -
 38
38 -
 39
39 -
 40
40 -
 41
41 -
 42
42 -
 43
43 -
 44
44 -
 45
45 -
 46
46 -
47
-
48
-
49
-
50
-
51
-
52
-
53
-
54
-
55
-
56
-
57
-
58
-
59
-
60
-
61
-
62
-
63
-
64
-
65
-
66
-
67
-
68
-
69
-
70
-
71
-
72
-
73
-
74
-
75
-
76
-
77
-
78
-
79
-
80
-
81
-
82
-
83
-
84
-
85
-
86
-
87
-
88
 |
 |
34
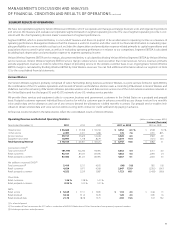
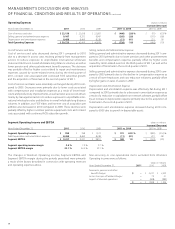
2011 Compared to 2010
TheincreaseinVerizonWireless’totaloperatingrevenueduring2011
compared to 2010 was primarily due to growth in service and equip-
ment revenue.
Connections
Total connections increased during 2011 compared to 2010 primarily
due to an increase in retail postpaid customer gross additions as well as
ongoing improvements in our retail customer churn rate, both of which
we believe were primarily the result of the strength of the devices in our
product portfolio, including the Apple iPhone 4 and 4S and our line-up
of 3G and 4G Android and other 4G LTE capable devices, as well as the
reliability of our network, partially offset by a year-over-year decline in net
additions from wholesale and other connections.
Total connections represent the total of our retail customers and whole-
sale and other connections. Wholesale and other connections include
customers from our reseller channel as well as connections from non-tra-
ditional wireless-enabled devices, such as those used to support vehicle
tracking, telematics services and machine-to-machine connections.
Retail(non-wholesale)customersarecustomersdirectlyservedandman-
agedbyVerizonWirelessthatuseitsbrandedservices.Retailpostpaid
customers represent individual lines of service for which a customer pays
in advance a monthly access charge in return for a monthly voice and/
or data service allowance, and use of any services beyond the allow-
ances is billed in arrears. Churn is the rate at which customers disconnect
individual lines of service. We expect to continue to experience retail
customer growth based on the strength of our product offerings and
network service quality.
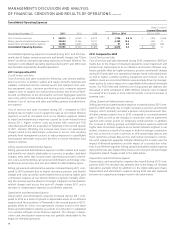
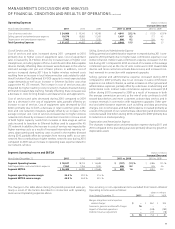
Service revenue
Service revenue increased during 2011 compared to 2010 primarily due
to the above-mentioned increase in total connections during the year, as
well as continued growth in data revenue, partially offset by a decline in
voice revenue.
Total data revenue was $23.6 billion and accounted for 40.0% of service
revenue during 2011 compared to $19.6 billion and 35.1% during 2010.
Total data revenue continues to increase as a result of the increased
penetration of our data offerings, in particular for higher-tier data ser-
vice plans which provide our customers with access to web and e-mail
via their wireless device. We have also experienced growth in data rev-
enues from the use of internet data devices such as tablets, USB modems
and Jetpacks. Voice revenue decreased as a result of continued declines
inretailpostpaidvoiceARPU,asdiscussedbelow,partiallyoffsetbyan
increase in the number of customers. We expect that total service revenue
and total data revenue will continue to grow as we grow our customer
base and increase the penetration of our data offerings as a larger propor-
tion of our customers use smartphones and other data-capable devices.
TheincreasesinretailserviceARPU(theaveragerevenueperuserper
monthfromretailcustomers)andretailpostpaidARPU(theaveragerev-
enue per user per month from retail postpaid customers) during 2011
compared to 2010 were due to a continued increase in our retail post-
paiddataARPU,offsetbyadeclineinourretailpostpaidvoiceARPU.
RetailpostpaiddataARPUincreasedasaresultofcontinuedgrowthin
the proportion of our customer base using smartphones, which grew to
43.5% of our retail postpaid customers as of December 31, 2011 com-
pared to 28.1% at December 31, 2010. However, both retail postpaid
ARPUandretailpostpaiddataARPUgrowthwereadverselyimpactedby
the growing proportion of our customers using internet data devices and
customers optimizing the value of their data packages for these devices.
Internet data devices represented 8.1% of our retail postpaid customer
base as of December 31, 2011 compared to 7.0% at December 31, 2010.
Inaddition,ourretailpostpaidvoiceARPUwas$32.64during2011,rep-
resenting a decline of $1.72, or 5.0%, compared to 2010 primarily due to
the ongoing impact of our retail customers seeking to optimize the value
of our voice minute bundles.
Other service revenue includes revenue from wholesale and other con-
nections as well as third party roaming revenue. Other service revenue
increased during 2011 compared to 2010 as a result of year-to-date
growth in wholesale and other connections, partially offset by a decrease
in third party roaming revenue.
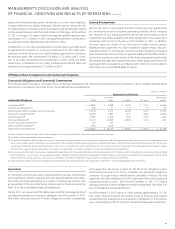
Equipment and Other Revenue
Equipment and other revenue increased during 2011 compared to 2010
due to an increase in the sales volume of smartphones to new and
upgrading customers. Partially offsetting these increases was a decrease
in the sales volume for basic phones in both periods.
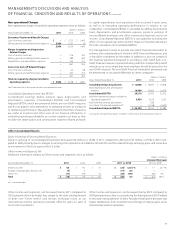
2010 Compared to 2009
TheincreaseinVerizonWireless’totaloperatingrevenueduring2010
compared to 2009 was primarily due to growth in service revenue.
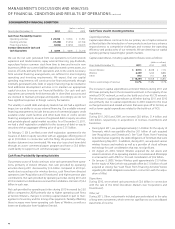
Connections
Total connections increased during 2010 compared to 2009 due to the
increase during the year in customer net additions from our reseller channel
as a result of the marketplace shift in customer activations during the first
half of the year toward unlimited prepaid offerings of the type being sold
by a number of resellers, as well as connections from non-traditional wire-
less-enabled devices, partially offset by the decline in retail customer net
additions. The decline in retail customer net additions during 2010 com-
pared to 2009 was due to a decrease in retail customer gross additions, as
well as an increase in churn for our retail prepaid base in part due to the
marketplace shift in customer activations mentioned above.
Customers from acquisitions and adjustments at December 31, 2010
included approximately 106,000 net customers, after conforming adjust-
ments, that we acquired in a transaction with AT&T. Customers from
acquisitions at December 31, 2009 included approximately 11.4 million
total customer net additions, after conforming adjustments and the
impact of required divestitures, which resulted from our acquisition of
AlltelinJanuary2009(see“AcquisitionsandDivestitures”).
Service revenue
Service revenue increased during 2010 compared to 2009 primarily due
to an increase in total customers since January 1, 2010, as well as con-
tinuedgrowthinourdataARPU,partiallyoffsetbyadeclineinvoiceARPU.
Total data revenue was $19.6 billion and accounted for 35.1% of service
revenue during 2010 compared to $15.6 billion and 29.9% during 2009.
Total data revenue increased as a result of the increased penetration of our
data offerings, in particular for web and e-mail services resulting in part
from increased sales of smartphone and other data-capable devices. Voice
revenuedecreasedasaresultofcontinueddeclinesinourvoiceARPU,as
discussed below, partially offset by an increase in the number of customers.
ThedeclineinserviceARPUduring2010comparedto2009wasdueto
a continued reduction in voice revenue per customer and the impact of
changes in our customer mix as a result of increased reseller customer net
additions,partiallyoffsetbyanincreaseinretailpostpaiddataARPU.Total
retailpostpaidvoiceARPUdeclined$2.18,or6.0%,duetotheongoing
impact of customers seeking to optimize the value of our voice minute
bundles.TotalretailpostpaiddataARPUincreasedasaresultofcontinued
growth and penetration of our data offerings resulting in part from the
above mentioned increase in sales of our smartphones and other data-
capabledevices.RetailserviceARPU,theaveragerevenueperuserfrom
retail customers, increased during 2010 due to increases in our penetration
of data offerings which more than offset declines in our voice revenues.
Equipment and Other Revenue
Equipment and other revenue decreased during 2010 compared to 2009
due to a decrease in the number of equipment units sold as a result of a
decrease in customer gross additions.
ManagEMEnt’s discussiOn and analYsis
OF Financial cOnditiOn and REsults OF OPERatiOns continued