Verizon Wireless 2011 Annual Report Download - page 81
Download and view the complete annual report
Please find page 81 of the 2011 Verizon Wireless annual report below. You can navigate through the pages in the report by either clicking on the pages listed below, or by using the keyword search tool below to find specific information within the annual report.-
 1
1 -
2
-
3
-
4
-
5
-
6
-
7
-
8
-
9
-
10
-
11
-
12
-
13
-
14
-
15
-
16
-
17
-
18
-
19
-
20
-
21
-
22
-
23
-
24
-
25
-
26
-
27
-
28
-
29
-
30
-
31
-
32
-
33
-
34
-
35
-
36
-
37
-
38
-
39
-
40
-
41
-
42
-
43
-
44
-
45
-
46
-
47
-
48
-
49
-
50
-
51
-
52
-
53
-
54
-
55
-
56
-
57
-
58
-
59
-
60
-
61
-
62
-
63
-
64
-
65
-
66
-
67
-
68
-
69
-
70
-
 71
71 -
 72
72 -
 73
73 -
 74
74 -
 75
75 -
 76
76 -
 77
77 -
 78
78 -
 79
79 -
 80
80 -
 81
81 -
 82
82 -
 83
83 -
 84
84 -
 85
85 -
 86
86 -
 87
87 -
 88
88
 |
 |

79
nOtEs tO cOnsOlidatEd Financial statEMEnts continued
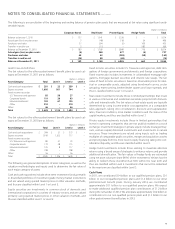
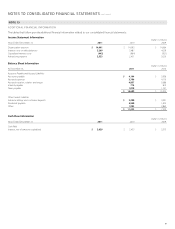
Reconciliation to Consolidated Financial Information
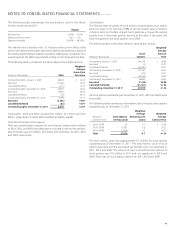
A reconciliation of the segment operating revenues to consolidated operating revenues is as follows:
(dollars in millions)
Years Ended December 31, 2011 2010 2009
Operating Revenues
Total reportable segments $ 110,836 $ 104,634 $ 102,776
Reconciling items:
Deferred revenue adjustment (see Note 1) –(235) 78
Impact of divested operations –2,407 5,297
Corporate, eliminations and other 39 (241) (343)
Consolidated operating revenues $ 110,875 $ 106,565 $ 107,808
A reconciliation of the total of the reportable segments’ operating income to consolidated Income before provision for income taxes is as follows:
(dollars in millions)
Years Ended December 31, 2011 2010 2009
Operating Income
Total segment operating income $ 19,486 $ 19,492 $ 18,211
Merger integration and acquisition related charges (see Note 2) –(867) (954)
Access line spin-off related charges (see Note 2) –(407) (453)
Severance, pension and benefit charges (see Note 11) (5,954) (3,054) (1,440)
Deferred revenue adjustment (see Note 1) –(235) 78
Impact of divested operations (see Note 2) –755 1,769
Corporate, eliminations and other (652) (1,039) (1,233)
Consolidated operating income 12,880 14,645 15,978
Equity in earnings of unconsolidated businesses 444 508 553
Other income and (expense), net (14) 54 91
Interest expense (2,827) (2,523) (3,102)
Income Before Provision for Income Taxes $ 10,483 $ 12,684 $ 13,520
A reconciliation of the total of the reportable segments’ assets to consolidated assets is as follows:
(dollars in millions)
At December 31, 2011 2010
Assets
Total reportable segments $ 233,563 $ 222,712
Corporate, eliminations and other (3,102) (2,707)
Total consolidated $ 230,461 $ 220,005
We generally account for intersegment sales of products and services and asset transfers at current market prices. No single customer accounted for
more than 10% of our total operating revenues during the years ended December 31, 2011, 2010 and 2009. International operating revenues and
long-lived assets are not significant.