Verizon Wireless 2011 Annual Report Download - page 56
Download and view the complete annual report
Please find page 56 of the 2011 Verizon Wireless annual report below. You can navigate through the pages in the report by either clicking on the pages listed below, or by using the keyword search tool below to find specific information within the annual report.-
 1
1 -
2
-
3
-
4
-
5
-
6
-
7
-
8
-
9
-
10
-
11
-
12
-
13
-
14
-
15
-
16
-
17
-
18
-
19
-
20
-
21
-
22
-
23
-
24
-
25
-
26
-
27
-
28
-
29
-
30
-
31
-
32
-
33
-
34
-
35
-
36
-
37
-
38
-
39
-
40
-
41
-
42
-
43
-
44
-
45
-
 46
46 -
 47
47 -
 48
48 -
 49
49 -
 50
50 -
 51
51 -
 52
52 -
 53
53 -
 54
54 -
 55
55 -
 56
56 -
 57
57 -
 58
58 -
 59
59 -
 60
60 -
 61
61 -
 62
62 -
 63
63 -
 64
64 -
 65
65 -
 66
66 -
67
-
68
-
69
-
70
-
71
-
72
-
73
-
74
-
75
-
76
-
77
-
78
-
79
-
80
-
81
-
82
-
83
-
84
-
85
-
86
-
87
-
88
 |
 |

54
VERIZON COMMUNICATIONS INC. AND SUBSIDIARIES
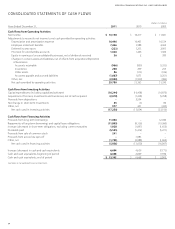
cOnsOlidatEd statEMEnts OF casH FlOWs
(dollars in millions)
Years Ended December 31, 2011 2010 2009
Cash Flows from Operating Activities
Net Income $ 10,198 $ 10,217 $ 11,601
Adjustments to reconcile net income to net cash provided by operating activities:
Depreciation and amortization expense 16,496 16,405 16,534
Employee retirement benefits 7,426 3,988 2,964
Deferred income taxes (223) 3,233 2,093
Provision for uncollectible accounts 1,026 1,246 1,306
Equity in earnings of unconsolidated businesses, net of dividends received 36 2 389
Changes in current assets and liabilities, net of effects from acquisition/disposition
of businesses
Accounts receivable (966) (859) (1,393)
Inventories 208 299 235
Other assets 86 (313) (102)
Accounts payable and accrued liabilities (1,607) 1,075 (1,251)
Other, net (2,900) (1,930) (986)
Net cash provided by operating activities 29,780 33,363 31,390
Cash Flows from Investing Activities
Capital expenditures (including capitalized software) (16,244) (16,458) (16,872)
Acquisitions of licenses, investments and businesses, net of cash acquired (2,018) (1,438) (5,958)
Proceeds from dispositions – 2,594 –
Net change in short-term investments 35 (3) 84
Other, net 977 251 (410)
Net cash used in investing activities (17,250) (15,054) (23,156)
Cash Flows from Financing Activities
Proceeds from long-term borrowings 11,060 – 12,040
Repayments of long-term borrowings and capital lease obligations (11,805) (8,136) (19,260)
Increase (decrease) in short-term obligations, excluding current maturities 1,928 (1,097) (1,652)
Dividends paid (5,555) (5,412) (5,271)
Proceeds from sale of common stock 241 – –
Proceeds from access line spin-off – 3,083 –
Other, net (1,705) (2,088) (1,864)
Net cash used in financing activities (5,836) (13,650) (16,007)
Increase (decrease) in cash and cash equivalents 6,694 4,659 (7,773)
Cash and cash equivalents, beginning of period 6,668 2,009 9,782
Cash and cash equivalents, end of period $ 13,362 $ 6,668 $ 2,009
See Notes to Consolidated Financial Statements