Verizon Wireless 2011 Annual Report Download - page 64
Download and view the complete annual report
Please find page 64 of the 2011 Verizon Wireless annual report below. You can navigate through the pages in the report by either clicking on the pages listed below, or by using the keyword search tool below to find specific information within the annual report.-
 1
1 -
2
-
3
-
4
-
5
-
6
-
7
-
8
-
9
-
10
-
11
-
12
-
13
-
14
-
15
-
16
-
17
-
18
-
19
-
20
-
21
-
22
-
23
-
24
-
25
-
26
-
27
-
28
-
29
-
30
-
31
-
32
-
33
-
34
-
35
-
36
-
37
-
38
-
39
-
40
-
41
-
42
-
43
-
44
-
45
-
46
-
47
-
48
-
49
-
50
-
51
-
52
-
53
-
 54
54 -
 55
55 -
 56
56 -
 57
57 -
 58
58 -
 59
59 -
 60
60 -
 61
61 -
 62
62 -
 63
63 -
 64
64 -
 65
65 -
 66
66 -
 67
67 -
 68
68 -
 69
69 -
 70
70 -
 71
71 -
 72
72 -
 73
73 -
 74
74 -
75
-
76
-
77
-
78
-
79
-
80
-
81
-
82
-
83
-
84
-
85
-
86
-
87
-
88
 |
 |

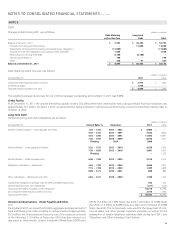
nOtEs tO cOnsOlidatEd Financial statEMEnts continued
62
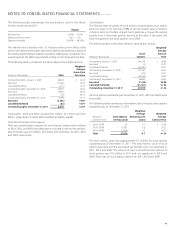
NOTE 3
WIRELESS LICENSES, GOODWILL AND OTHER INTANGIBLE ASSETS
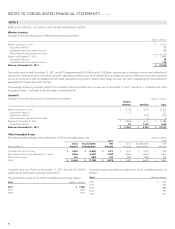
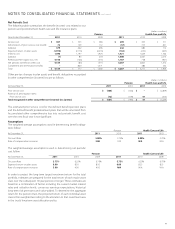
Wireless Licenses
Changes in the carrying amount of Wireless licenses are as follows:
(dollars in millions)
Balance at January 1, 2010 $ 72,067
Acquisitions (Note 2) 178
Capitalized interest on wireless licenses 748
Reclassifications, adjustments and other 3
Balance at December 31, 2010 $ 72,996
Acquisitions (Note 2) 58
Capitalized interest on wireless licenses 196
Balance at December 31, 2011 $ 73,250
During the years ended December 31, 2011 and 2010, approximately $2.2 billion and $12.2 billion, respectively, of wireless licenses were under devel-
opment for commercial service for which we were capitalizing interest costs. In December 2010, a substantial portion of these licenses were placed in
service in connection with our deployment of fourth-generation Long-Term Evolution technology services. See Note 2 regarding the December 2011
agreement to acquire spectrum licenses.
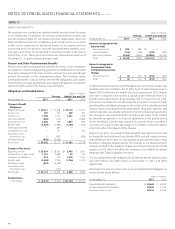
The average remaining renewal period of our wireless license portfolio was 6.4 years as of December 31, 2011 (see Note 1, Goodwill and Other
Intangible Assets – Intangible Assets Not Subject to Amortization).
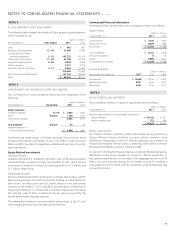
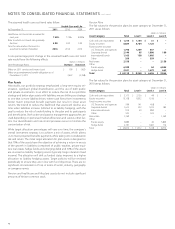
Goodwill
Changes in the carrying amount of Goodwill are as follows: (dollars in millions)
Verizon
Wireless Wireline Total
Balance at January 1, 2010 $ 17,738 $ 4,734 $ 22,472
Acquisitions (Note 2) 131 – 131
Dispositions (Note 2) – (614) (614)
Reclassifications, adjustments and other – (1) (1)
Balance at December 31, 2010 $ 17,869 $ 4,119 $ 21,988
Acquisitions (Note 2) 94 1,275 1,369
Balance at December 31, 2011 $ 17,963 $ 5,394 $ 23,357
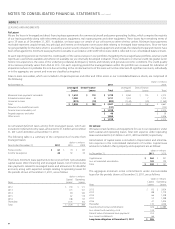
Other Intangible Assets
The following table displays the composition of Other intangible assets, net: (dollars in millions)
2011 2010
At December 31,
Gross
Amount
Accumulated
Amortization
Net
Amount
Gross
Amount
Accumulated
Amortization
Net
Amount
Customer lists (6 to 13 years) $ 3,529 $ (2,052) $ 1,477 $ 3,150 $ (1,551) $ 1,599
Non-network internal-use software (3 to 7 years) 9,536 (5,487) 4,049 8,446 (4,614) 3,832
Other (2 to 25 years) 561 (209) 352 885 (486) 399
Total $ 13,626 $ (7,748) $ 5,878 $ 12,481 $ (6,651) $ 5,830
Customer lists and Other at December 31, 2011 include $0.4 billion
related to the Terremark acquisition (see Note 2).
The amortization expense for Other intangible assets was as follows:
Years (dollars in millions)
2011 $ 1,505
2010 1,812
2009 1,970
Estimated annual amortization expense for Other intangible assets is as
follows:
Years (dollars in millions)
2012 $ 1,363
2013 1,193
2014 884
2015 695
2016 491