Verizon Wireless 2011 Annual Report Download - page 47
Download and view the complete annual report
Please find page 47 of the 2011 Verizon Wireless annual report below. You can navigate through the pages in the report by either clicking on the pages listed below, or by using the keyword search tool below to find specific information within the annual report.-
 1
1 -
2
-
3
-
4
-
5
-
6
-
7
-
8
-
9
-
10
-
11
-
12
-
13
-
14
-
15
-
16
-
17
-
18
-
19
-
20
-
21
-
22
-
23
-
24
-
25
-
26
-
27
-
28
-
29
-
30
-
31
-
32
-
33
-
34
-
35
-
36
-
 37
37 -
 38
38 -
 39
39 -
 40
40 -
 41
41 -
 42
42 -
 43
43 -
 44
44 -
 45
45 -
 46
46 -
 47
47 -
 48
48 -
 49
49 -
 50
50 -
 51
51 -
 52
52 -
 53
53 -
 54
54 -
 55
55 -
 56
56 -
 57
57 -
58
-
59
-
60
-
61
-
62
-
63
-
64
-
65
-
66
-
67
-
68
-
69
-
70
-
71
-
72
-
73
-
74
-
75
-
76
-
77
-
78
-
79
-
80
-
81
-
82
-
83
-
84
-
85
-
86
-
87
-
88
 |
 |

45
Critical Accounting Estimates
A summary of the critical accounting estimates used in preparing our
financial statements is as follows:
• Wireless licenses and Goodwill are a significant component of our con-
solidated assets. Both our wireless licenses and goodwill are treated as
indefinite-lived intangible assets and, therefore are not amortized, but
rather are tested for impairment annually in the fourth fiscal quarter,
unless there are events or changes in circumstances during an interim
period that indicates these assets may not be recoverable. We believe
our estimates and assumptions are reasonable and represent appro-
priate marketplace considerations as of the valuation date. We do not
believe that reasonably likely adverse changes in our assumptions and
estimates would result in an impairment charge as of our latest impair-
ment testing date. However, if there is a substantial and sustained
adverse decline in our operating profitability, we may have impairment
charges in future years. Any such impairment charge could be material
to our results of operations and financial condition.
Wireless Licenses
The carrying value of our wireless licenses was approximately $73.3
billion as of December 31, 2011. We aggregate our wireless licenses
into one single unit of accounting, as we utilize our wireless licenses
on an integrated basis as part of our nationwide wireless network. Our
wireless licenses provide us with the exclusive right to utilize certain
radio frequency spectrum to provide wireless communication services.
There are currently no legal, regulatory, contractual, competitive, eco-
nomic or other factors that limit the useful life of our wireless licenses.
Our impairment test consists of comparing the estimated fair value of
our wireless licenses to the aggregated carrying amount as of the test
date. If the estimated fair value of our wireless licenses is less than the
aggregated carrying amount of the wireless licenses then an impair-
ment charge is recognized. Our annual impairment tests for 2011,
2010 and 2009 indicated that the fair value significantly exceeded the
carrying value and, therefore, did not result in an impairment.
We estimate the fair value of our wireless licenses using a direct income
based valuation approach. This approach uses a discounted cash flow
analysis to estimate what a marketplace participant would be willing
to pay to purchase the aggregated wireless licenses as of the valuation
date. As a result we are required to make significant estimates about
future cash flows specifically associated with our wireless licenses,
an appropriate discount rate based on the risk associated with those
estimated cash flows and assumed terminal value and growth rates.
We consider current and expected future economic conditions, cur-
rent and expected availability of wireless network technology and
infrastructure and related equipment and the costs thereof as well as
other relevant factors in estimating future cash flows. The discount rate
represents our estimate of the weighted average cost of capital (or
expectedreturn,“WACC”)thatamarketplaceparticipantwouldrequire
as of the valuation date. We develop the discount rate based on our
consideration of the cost of debt and equity of a group of guideline
companies as of the valuation date. Accordingly, our discount rate
incorporates our estimate of the expected return a marketplace partici-
pant would require as of the valuation date, including the risk premium
associated with the current and expected economic conditions as of
the valuation date. The terminal value growth rate represents our esti-
mateofthemarketplace’slong-termgrowthrate.
Goodwill
At December 31, 2011, the balance of our goodwill was approximately
$23.4 billion, of which $18.0 billion was in our Wireless segment and
$5.4 billion was in our Wireline segment. Determining whether an
impairment has occurred requires the determination of fair value
of each respective reporting unit. Our operating segments, Verizon
Wireless and Wireline, are deemed to be our reporting units for
purposes of goodwill impairment testing. The fair value of Verizon
Wireless and Wireline exceeded their carrying value. Accordingly, our
annual impairment tests for 2011, 2010 and 2009 did not result in
an impairment.
The fair value of the reporting unit is calculated using a market approach
and a discounted cash flow method. The market approach includes the
use of comparative multiples to corroborate discounted cash flow
results. The discounted cash flow method is based on the present value
of two components — projected cash flows and a terminal value. The
terminal value represents the expected normalized future cash flows of
the reporting unit beyond the cash flows from the discrete projection
period. The fair value of the reporting unit is calculated based on the
sum of the present value of the cash flows from the discrete period and
the present value of the terminal value. The estimated cash flows are
discounted using a rate that represents our WACC.
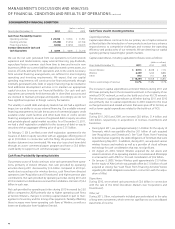
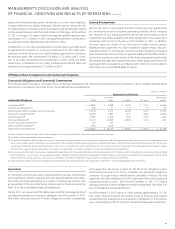
• We maintain benefit plans for most of our employees, including, for
certain employees, pension and other postretirement benefit plans.
At December 31, 2011, in the aggregate, pension plan benefit obliga-
tions exceeded the fair value of pension plan assets, which will result in
higher future pension plan expense. Other postretirement benefit plans
have larger benefit obligations than plan assets, resulting in expense.
Significant benefit plan assumptions, including the discount rate used,
the long-term rate of return on plan assets and health care trend rates
are periodically updated and impact the amount of benefit plan income,
expense, assets and obligations. A sensitivity analysis of the impact of
changes in these assumptions on the benefit obligations and expense
(income) recorded, as well as on the funded status due to an increase
or a decrease in the actual versus expected return on plan assets as of
December31,2011andfortheyearthenendedpertainingtoVerizon’s
pension and postretirement benefit plans is provided in the table below.
(dollars in millions)
Percentage
point
change
Increase
(decrease) at
December 31, 2011*
Pension plans discount rate +0.50 $ (1,525)
-0.50 1,682
Rateofreturnonpensionplanassets +1.00 (247)
-1.00 247
Postretirement plans discount rate +0.50 (1,654)
-0.50 1,855
Rateofreturnonpostretirement
plan assets +1.00 (27)
-1.00 27
Health care trend rates +1.00 3,422
-1.00 (2,768)
* In determining its pension and other postretirement obligation, the Company used a 5.0%
discount rate. The rate was selected to approximate the composite interest rates available
on a selection of high-quality bonds available in the market at December 31, 2011. The
bonds selected had maturities that coincided with the time periods during which benefits
payments are expected to occur, were non-callable and available in sufficient quantities to
ensure marketability (at least $0.3 billion par outstanding).
ManagEMEnt’s discussiOn and analYsis
OF Financial cOnditiOn and REsults OF OPERatiOns continued
CRITICAL ACCOUNTING ESTIMATES AND RECENT ACCOUNTING STANDARDS