Verizon Wireless 2011 Annual Report Download - page 71
Download and view the complete annual report
Please find page 71 of the 2011 Verizon Wireless annual report below. You can navigate through the pages in the report by either clicking on the pages listed below, or by using the keyword search tool below to find specific information within the annual report.-
 1
1 -
2
-
3
-
4
-
5
-
6
-
7
-
8
-
9
-
10
-
11
-
12
-
13
-
14
-
15
-
16
-
17
-
18
-
19
-
20
-
21
-
22
-
23
-
24
-
25
-
26
-
27
-
28
-
29
-
30
-
31
-
32
-
33
-
34
-
35
-
36
-
37
-
38
-
39
-
40
-
41
-
42
-
43
-
44
-
45
-
46
-
47
-
48
-
49
-
50
-
51
-
52
-
53
-
54
-
55
-
56
-
57
-
58
-
59
-
60
-
 61
61 -
 62
62 -
 63
63 -
 64
64 -
 65
65 -
 66
66 -
 67
67 -
 68
68 -
 69
69 -
 70
70 -
 71
71 -
 72
72 -
 73
73 -
 74
74 -
 75
75 -
 76
76 -
 77
77 -
 78
78 -
 79
79 -
 80
80 -
 81
81 -
82
-
83
-
84
-
85
-
86
-
87
-
88
 |
 |

nOtEs tO cOnsOlidatEd Financial statEMEnts continued
69
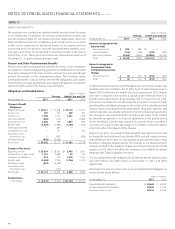
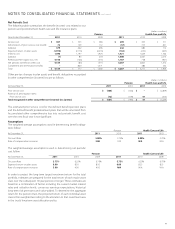
Stock Options
The Plan provides for grants of stock options to participants at an option
price per share of no less than 100% of the fair market value of Verizon
common stock on the date of grant. Each grant has a 10-year life, vesting
equally over a three-year period, starting at the date of the grant. We
have not granted new stock options since 2004.
The following table summarizes Verizon’s stock option activity:
(shares in thousands)
Stock
Options
Weighted-
Average
Exercise
Price
Outstanding, January 1, 2009 140,158 $ 45.86
Exercised (2) 25.32
Cancelled/Forfeited (32,391) 50.31
Outstanding, December 31, 2009 107,765 44.52
Exercised (372) 34.51
Cancelled/Forfeited (50,549) 44.90
Outstanding, December 31, 2010 56,844 44.25
Exercised (7,104) 35.00
Cancelled/Forfeited (21,921) 51.06
Outstanding, December 31, 2011 27,819 41.24
All stock options outstanding at December 31, 2011, 2010 and 2009 were
exercisable.
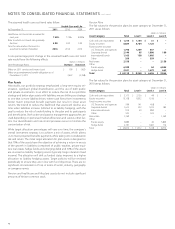
The following table summarizes information about Verizon’s stock options
outstanding as of December 31, 2011:
Range of
Exercise Prices
Stock Options
(in thousands)
Weighted-
Average
Remaining Life
(years)
Weighted-
Average
Exercise Price
$ 20.00–29.99 24 0.7 $ 27.66
30.00–39.99 10,791 1.6 35.02
40.00–49.99 17,004 0.1 45.21
Total 27,819 0.7 41.24
The total intrinsic value was approximately $0.1 billion for stock options
outstanding as of December 31, 2011. The total intrinsic value of stock
options exercised and the associated tax benefits were not significant in
2011, 2010 and 2009. The amount of cash received from the exercise of
stock options was $0.2 billion in 2011 and not significant in 2010 and
2009. There was no stock option expense for 2011, 2010 and 2009.
The following table summarizes the assumptions used in the Black-
Scholes model during 2011:
Ranges
Risk-free rate 0.05% – 0.57%
Expected term (in years) 0.02 – 1.50
Expected volatility 29.47% – 48.30%
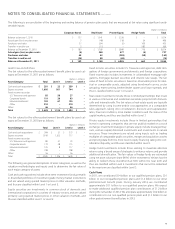
The risk-free rate is based on the U.S. Treasury yield curve in effect at the
time of the measurement date. Expected volatility was based on a blend of
the historical and implied volatility of publicly traded peer companies for a
period equal to the VARs expected life ending on the measurement date.
The following table summarizes the Value Appreciation Rights activity:
(shares in thousands) VARs
Weighted-
Average
Grant-Date
Fair Value
Outstanding rights, January 1, 2009 28,244 $ 16.54
Exercised (11,442) 16.53
Cancelled/Forfeited (211) 17.63
Outstanding rights, December 31, 2009 16,591 16.54
Exercised (4,947) 24.47
Cancelled/Forfeited (75) 22.72
Outstanding rights, December 31, 2010 11,569 13.11
Exercised (3,303) 14.87
Cancelled/Forfeited (52) 14.74
Outstanding rights, December 31, 2011 8,214 12.39
During 2011, 2010 and 2009, we paid $0.1 billion, $0.1 billion and $0.2
billion, respectively, to settle VARs classified as liability awards.
Stock-Based Compensation Expense
After-tax compensation expense for stock-based compensation related
to RSUs, PSUs, and VARs described above included in net income attribut-
able to Verizon was $0.5 billion, $0.5 billion and $0.5 billion for 2011, 2010
and 2009, respectively.