Verizon Wireless 2011 Annual Report Download - page 42
Download and view the complete annual report
Please find page 42 of the 2011 Verizon Wireless annual report below. You can navigate through the pages in the report by either clicking on the pages listed below, or by using the keyword search tool below to find specific information within the annual report.-
 1
1 -
2
-
3
-
4
-
5
-
6
-
7
-
8
-
9
-
10
-
11
-
12
-
13
-
14
-
15
-
16
-
17
-
18
-
19
-
20
-
21
-
22
-
23
-
24
-
25
-
26
-
27
-
28
-
29
-
30
-
31
-
 32
32 -
 33
33 -
 34
34 -
 35
35 -
 36
36 -
 37
37 -
 38
38 -
 39
39 -
 40
40 -
 41
41 -
 42
42 -
 43
43 -
 44
44 -
 45
45 -
 46
46 -
 47
47 -
 48
48 -
 49
49 -
 50
50 -
 51
51 -
 52
52 -
53
-
54
-
55
-
56
-
57
-
58
-
59
-
60
-
61
-
62
-
63
-
64
-
65
-
66
-
67
-
68
-
69
-
70
-
71
-
72
-
73
-
74
-
75
-
76
-
77
-
78
-
79
-
80
-
81
-
82
-
83
-
84
-
85
-
86
-
87
-
88
 |
 |

40
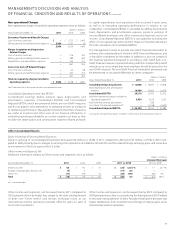
Cash Flows Used In Investing Activities
Capital Expenditures
Capital expenditures continue to be our primary use of capital resources
as they facilitate the introduction of new products and services, enhance
responsiveness to competitive challenges and increase the operating
efficiency and productivity of our networks. We are directing our capital
spending primarily toward higher growth markets.
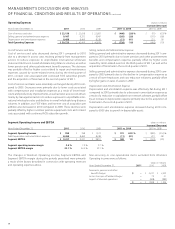
Capital expenditures, including capitalized software, were as follows:
(dollars in millions)
Years Ended December 31, 2011 2010 2009
Verizon Wireless $ 8,973 $ 8,438 $ 7,152
Wireline 6,399 7,269 8,892
Other 872 751 828
$ 16,244 $ 16,458 $ 16,872
Total as a percentage of revenue 14.7% 15.4% 15.7%
The increase in capital expenditures at Verizon Wireless during 2011 and
2010 was primarily due to the increased investment in the capacity of our
wireless EV-DO network, as well as the build-out of our 4G LTE network.
The decrease in capital expenditures at Wireline during 2011 and 2010
was primarily due to capital expenditures in 2010 related to the local
exchangebusinessandrelatedactivitiesthatwerespunofftoFrontier,as
wellaslowercapitalexpendituresrelatedtothebuild-outofFiOS.
Acquisitions
During 2011, 2010 and 2009, we invested $2.0 billion, $1.4 billion and
$6.0 billion, respectively, in acquisitions of licenses, investments and
businesses.
• During April 2011, we paid approximately $1.4 billion for the equity of
Terremark, which was partially offset by $0.1 billion of cash acquired
(see“Acquisitionsand Divestitures”).See“Cash Flows FromFinancing
Activities”belowregardingthedebtobligationsofTerremarkthatwere
repaidduringMay2011.Inaddition,during2011,weacquiredvarious
wireless licenses and markets as well as a provider of cloud software
technology for cash consideration that was not significant.
• On August 23, 2010, Verizon Wireless acquired the net assets and
relatedcustomersofsixoperatingmarketsinLouisianaandMississippi
in a transaction with AT&T Inc. for cash consideration of $0.2 billion.
• On January 9, 2009, Verizon Wireless paid approximately $5.9 billion
for the equity of Alltel, which was partially offset by $1.0 billion of cash
acquiredatclosing.See“CashFlowsFromFinancingActivities”below
regarding the debt obligations assumed in connection with the acqui-
sition of Alltel.
Dispositions
During 2010, we received cash proceeds of $2.6 billion in connection
with the sale of the Alltel Divestiture Markets (see“Acquisitions and
Divestitures”).
Other, net
During 2011, Other, net primarily included proceeds related to the sales
of long-term investments, which were not significant to our consolidated
statements of income.
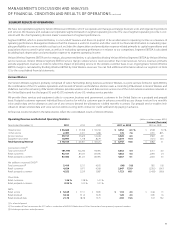
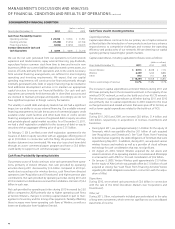
CONSOLIDATED FINANCIAL CONDITION
(dollars in millions)
Years Ended December 31, 2011 2010 2009
Cash Flows Provided By (Used In)
Operating activities $ 29,780 $ 33,363 $ 31,390
Investing activities (17,250) (15,054) (23,156)
Financingactivities (5,836) (13,650) (16,007)
Increase (Decrease) In Cash and
Cash Equivalents $ 6,694 $ 4,659 $ (7,773)
We use the net cash generated from our operations to fund network
expansion and modernization, repay external financing, pay dividends,
repurchase Verizon common stock from time to time and invest in new
businesses. While our current liabilities typically exceed current assets, our
sources of funds, primarily from operations and, to the extent necessary,
from external financing arrangements, are sufficient to meet ongoing
operating and investing requirements. We expect that our capital
spending requirements will continue to be financed primarily through
internally generated funds. Debt or equity financing may be needed to
fund additional development activities or to maintain an appropriate
capital structure to ensure our financial flexibility. Our cash and cash
equivalents are primarily held domestically in diversified accounts and
are invested to maintain principal and liquidity. Accordingly, we do not
have significant exposure to foreign currency fluctuations.
The volatility in world debt and equity markets has not had a significant
impact on our ability to access external financing. Our available external
financing arrangements include the issuance of commercial paper, credit
available under credit facilities and other bank lines of credit, vendor
financing arrangements, issuances of registered debt or equity securities
and privately-placed capital market securities. As of December 31, 2011,
we had a shelf registration available for the issuance of debt or equity
securities with an aggregate offering price of up to $3.15 billion.
OnFebruary7,2012,wefiledanewshelfregistrationstatementforthe
issuance of debt or equity securities with an aggregate offering price of
up to $10 billion. In connection with this filing, the previous shelf reg-
istration statement was terminated. We may also issue short-term debt
through an active commercial paper program and have a $6.2 billion
credit facility to support such commercial paper issuances.
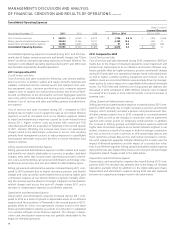
Cash Flows Provided By Operating Activities
Our primary source of funds continues to be cash generated from opera-
tions, primarily of Verizon Wireless. Net cash provided by operating
activities during 2011 decreased by $3.6 billion compared to 2010 pri-
marily due to purchases for wireless devices, cash flows from divested
operations(see“AcquisitionsandDivestitures”)andhigherpensionplan
contributions. Net cash provided by operating activities during 2011 and
2010 included net distributions received from Vodafone Omnitel of $0.4
billion in each year.
Net cash provided by operating activities during 2010 increased by $2.0
billion compared to 2009 primarily due to higher operating cash flows
at Verizon Wireless, changes in working capital related in part to man-
agement of inventory and the timing of tax payments. Partially offsetting
these increases were lower operating cash flows at Wireline, as well as a
lower net distribution from Vodafone Omnitel.
ManagEMEnt’s discussiOn and analYsis
OF Financial cOnditiOn and REsults OF OPERatiOns continued