Verizon Wireless 2011 Annual Report Download - page 35
Download and view the complete annual report
Please find page 35 of the 2011 Verizon Wireless annual report below. You can navigate through the pages in the report by either clicking on the pages listed below, or by using the keyword search tool below to find specific information within the annual report.-
 1
1 -
2
-
3
-
4
-
5
-
6
-
7
-
8
-
9
-
10
-
11
-
12
-
13
-
14
-
15
-
16
-
17
-
18
-
19
-
20
-
21
-
22
-
23
-
24
-
 25
25 -
 26
26 -
 27
27 -
 28
28 -
 29
29 -
 30
30 -
 31
31 -
 32
32 -
 33
33 -
 34
34 -
 35
35 -
 36
36 -
 37
37 -
 38
38 -
 39
39 -
 40
40 -
 41
41 -
 42
42 -
 43
43 -
 44
44 -
 45
45 -
46
-
47
-
48
-
49
-
50
-
51
-
52
-
53
-
54
-
55
-
56
-
57
-
58
-
59
-
60
-
61
-
62
-
63
-
64
-
65
-
66
-
67
-
68
-
69
-
70
-
71
-
72
-
73
-
74
-
75
-
76
-
77
-
78
-
79
-
80
-
81
-
82
-
83
-
84
-
85
-
86
-
87
-
88
 |
 |

33
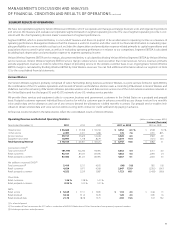
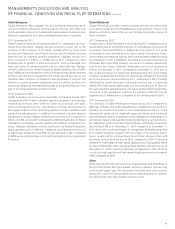
SEGMENT RESULTS OF OPERATIONS
We have two reportable segments, Verizon Wireless and Wireline, which we operate and manage as strategic business units and organize by products
and services. We measure and evaluate our reportable segments based on segment operating income. The use of segment operating income is con-
sistentwiththechiefoperatingdecisionmaker’sassessmentofsegmentperformance.
Segment EBITDA, which is presented below, is a non-GAAP measure and does not purport to be an alternative to operating income as a measure of
operatingperformance.Managementbelievesthatthismeasureisusefultoinvestorsandotherusersofourfinancialinformationinevaluatingoper-
ating profitability on a more variable cost basis as it excludes the depreciation and amortization expense related primarily to capital expenditures and
acquisitions that occurred in prior years, as well as in evaluating operating performance in relation to our competitors. Segment EBITDA is calculated
by adding back depreciation and amortization expense to segment operating income.
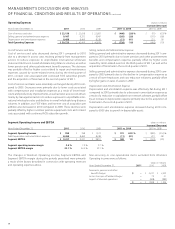
Verizon Wireless Segment EBITDA service margin, also presented below, is calculated by dividing Verizon Wireless Segment EBITDA by Verizon Wireless
service revenues. Verizon Wireless Segment EBITDA service margin utilizes service revenues rather than total revenues. Service revenues primarily
exclude equipment revenues in order to reflect the impact of providing service to the wireless customer base on an ongoing basis. Verizon Wireline
EBITDA margin is calculated by dividing Wireline EBITDA by total Wireline revenues. You can find additional information about our segments in Note
13 to the consolidated financial statements.
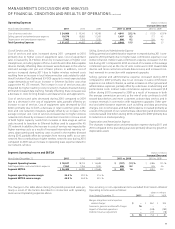
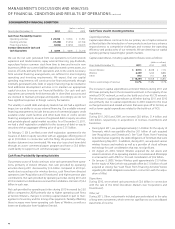
Verizon Wireless
Our Verizon Wireless segment, primarily comprised of Cellco Partnership doing business as Verizon Wireless, is a joint venture formed in April 2000 by
the combination of the U.S. wireless operations and interests of Verizon and Vodafone. Verizon owns a controlling 55% interest in Verizon Wireless and
Vodafone owns the remaining 45%. Verizon Wireless provides wireless voice and data services across one of the most extensive wireless networks in
the United States and has the largest 3G and 4G LTE networks of any U.S. wireless service provider.
We provide these services and equipment sales to consumer, business and government customers in the United States on a postpaid and prepaid
basis. Postpaid customers represent individual lines of service for which a customer pays in advance a monthly access charge in return for a monthly
voice and/or data service allowance, and use of any services beyond the allowances is billed monthly in arrears. Our prepaid service enables indi-
viduals to obtain wireless data and voice services without a long-term contract or credit verification by paying in advance.
All financial results included in the tables below reflect the consolidated results of Verizon Wireless.
Operating Revenue and Selected Operating Statistics (dollarsinmillions,exceptARPU)
Increase/(Decrease)
Years Ended December 31, 2011 2010 2009 2011 vs. 2010 2010 vs. 2009
Retailservice $ 56,660 $ 53,308 $ 50,760 $ 3,352 6.3 % $ 2,548 5.0 %
Other service 2,497 2,321 1,286 176 7.6 1,035 80.5
Service revenue 59,157 55,629 52,046 3,528 6.3 3,583 6.9
Equipment and other 10,997 7,778 8,279 3,219 41.4 (501) (6.1)
Total Operating Revenue $ 70,154 $ 63,407 $ 60,325 $ 6,747 10.6 $ 3,082 5.1
Connections(’000):(1)
Total connections(2) 107,798 102,246 96,495 5,552 5.4 5,751 6.0
Retailcustomers 92,167 87,535 85,445 4,632 5.3 2,090 2.4
Retailpostpaidcustomers 87,382 83,125 80,495 4,257 5.1 2,630 3.3
Netadditionsinperiod(’000):(3)
Total connections(2) 5,419 5,517 4,935 (98) (1.8) 582 11.8
Retailcustomers 4,624 1,977 4,369 2,647 133.9 (2,392) (54.7)
Retailpostpaidcustomers 4,252 2,529 3,987 1,723 68.1 (1,458) (36.6)
ChurnRate:
Retailcustomers 1.26 % 1.38 % 1.41 %
Retailpostpaidcustomers 0.95 % 1.02 % 1.07 %
ARPU:
Retailservice $ 52.69 $ 51.51 $ 50.85 $ 1.18 2.3 $ 0.66 1.3
Retailpostpaid 54.34 53.14 52.29 1.20 2.3 0.85 1.6
Retailpostpaiddata 21.70 18.78 15.75 2.92 15.5 3.03 19.2
(1) As of end of period.
(2) The number of Total connections for 2011 reflects a reduction of 869,000 Wholesale and Other Connections from previously reported numbers.
(3) Excluding acquisitions and adjustments.
ManagEMEnt’s discussiOn and analYsis
OF Financial cOnditiOn and REsults OF OPERatiOns continued