Verizon Wireless 2011 Annual Report Download - page 74
Download and view the complete annual report
Please find page 74 of the 2011 Verizon Wireless annual report below. You can navigate through the pages in the report by either clicking on the pages listed below, or by using the keyword search tool below to find specific information within the annual report.-
 1
1 -
2
-
3
-
4
-
5
-
6
-
7
-
8
-
9
-
10
-
11
-
12
-
13
-
14
-
15
-
16
-
17
-
18
-
19
-
20
-
21
-
22
-
23
-
24
-
25
-
26
-
27
-
28
-
29
-
30
-
31
-
32
-
33
-
34
-
35
-
36
-
37
-
38
-
39
-
40
-
41
-
42
-
43
-
44
-
45
-
46
-
47
-
48
-
49
-
50
-
51
-
52
-
53
-
54
-
55
-
56
-
57
-
58
-
59
-
60
-
61
-
62
-
63
-
 64
64 -
 65
65 -
 66
66 -
 67
67 -
 68
68 -
 69
69 -
 70
70 -
 71
71 -
 72
72 -
 73
73 -
 74
74 -
 75
75 -
 76
76 -
 77
77 -
 78
78 -
 79
79 -
 80
80 -
 81
81 -
 82
82 -
 83
83 -
 84
84 -
85
-
86
-
87
-
88
 |
 |

nOtEs tO cOnsOlidatEd Financial statEMEnts continued
72
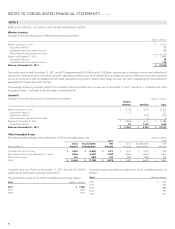
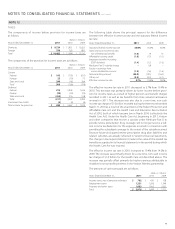
The assumed health care cost trend rates follow:
Health Care and Life
At December 31, 2011 2010 2009
Healthcare cost trend rate assumed for
next year 7.50 % 7.75 % 8.00 %
Rate to which cost trend rate gradually
declines 5.00 5.00 5.00
Year the rate reaches the level it is
assumed to remain thereafter 2016 2016 2014
A one percentage point change in the assumed health care cost trend
rate would have the following effects:
(dollars in millions)
One-Percentage Point Increase Decrease
Effect on 2011 service and interest cost $ 199 $ (163)
Effect on postretirement benefit obligation as of
December 31, 2011 3,422 (2,768)
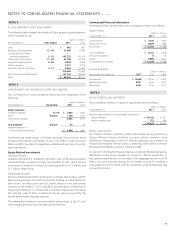
Plan Assets
Historically, our portfolio strategy emphasized a long-term equity ori-
entation, significant global diversification, and the use of both public
and private investments. In an effort to reduce the risk of our portfolio
strategy and better align assets with liabilities, we are shifting our strategy
to one that is more liability driven, where cash flows from investments
better match projected benefit payments but result in lower asset
returns. We intend to reduce the likelihood that assets will decline at a
time when liabilities increase (referred to as liability hedging), with the
goal to reduce the risk of underfunding to the plan and its participants
and beneficiaries. Both active and passive management approaches are
used depending on perceived market efficiencies and various other fac-
tors. Our diversification and risk control processes serve to minimize the
concentration of risk.
While target allocation percentages will vary over time, the company’s
overall investment strategy is to achieve a mix of assets, which allows
us to meet projected benefits payments while taking into consideration
risk and return. The initial target allocation for plan assets is designed so
that 70% of the assets have the objective of achieving a return in excess
of the growth in liabilities (comprised of public equities, private equi-
ties, real estate, hedge funds and emerging debt) and 30% of the assets
are invested as liability hedging assets (typically longer duration fixed
income). This allocation will shift as funded status improves to a higher
allocation to liability hedging assets. Target policies will be revisited
periodically to ensure they are in line with fund objectives. There are no
significant concentrations of risk, in terms of sector, industry, geography
or company names.
Pension and healthcare and life plans assets do not include significant
amounts of Verizon common stock.
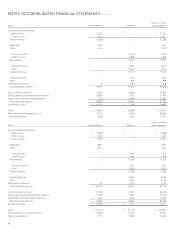
Pension Plans
The fair values for the pension plans by asset category at December 31,
2011 are as follows:
(dollars in millions)
Asset Category Total Level 1 Level 2 Level 3
Cash and cash equivalents $ 1,215 $ 1,184 $ 31 $ –
Equity securities 6,829 5,704 1,125 –
Fixed income securities
U.S. Treasuries and agencies 1,796 1,239 557 –
Corporate bonds 2,140 65 1,886 189
International bonds 1,163 158 1,005 –
Other 359 – 359 –
Real estate 2,158 – – 2,158
Other
Private equity 6,109 – 54 6,055
Hedge funds 2,341 – 1,679 662
Total $ 24,110 $ 8,350 $ 6,696 $ 9,064
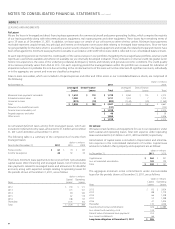
The fair values for the pension plans by asset category at December 31,
2010 are as follows:
(dollars in millions)
Asset Category Total Level 1 Level 2 Level 3
Cash and cash equivalents $ 2,175 $ 2,126 $ 49 $ –
Equity securities 10,158 9,052 1,106 –
Fixed income securities
U.S. Treasuries and agencies 599 141 458 –
Corporate bonds 1,615 233 1,202 180
International bonds 910 20 890 –
Other 502 – 502 –
Real estate 1,769 – – 1,769
Other
Private equity 5,889 – 40 5,849
Hedge funds 2,197 – 1,481 716
Total $ 25,814 $ 11,572 $ 5,728 $ 8,514