Verizon Wireless 2011 Annual Report Download - page 37
Download and view the complete annual report
Please find page 37 of the 2011 Verizon Wireless annual report below. You can navigate through the pages in the report by either clicking on the pages listed below, or by using the keyword search tool below to find specific information within the annual report.-
 1
1 -
2
-
3
-
4
-
5
-
6
-
7
-
8
-
9
-
10
-
11
-
12
-
13
-
14
-
15
-
16
-
17
-
18
-
19
-
20
-
21
-
22
-
23
-
24
-
25
-
26
-
 27
27 -
 28
28 -
 29
29 -
 30
30 -
 31
31 -
 32
32 -
 33
33 -
 34
34 -
 35
35 -
 36
36 -
 37
37 -
 38
38 -
 39
39 -
 40
40 -
 41
41 -
 42
42 -
 43
43 -
 44
44 -
 45
45 -
 46
46 -
 47
47 -
48
-
49
-
50
-
51
-
52
-
53
-
54
-
55
-
56
-
57
-
58
-
59
-
60
-
61
-
62
-
63
-
64
-
65
-
66
-
67
-
68
-
69
-
70
-
71
-
72
-
73
-
74
-
75
-
76
-
77
-
78
-
79
-
80
-
81
-
82
-
83
-
84
-
85
-
86
-
87
-
88
 |
 |

35
ManagEMEnt’s discussiOn and analYsis
OF Financial cOnditiOn and REsults OF OPERatiOns continued
Cost of Services and Sales
Cost of services and sales increased during 2011 compared to 2010
primarily due to higher costs of equipment sales. Cost of equipment
sales increased by $4.9 billion driven by increased sales of higher cost
smartphones,includingApple’siPhone4and4Sandotherdata-capable
devices. Partially offsetting these increases were decreases in the volume
sold and average cost per unit of basic phones. In addition, cost of
services increased during 2011 due to higher wireless network costs
resulting from an increase in local interconnection costs related to addi-
tional Evolution-Data Optimized (EV-DO) capacity to meet expected data
usage demands as well as an increase in Ethernet facilities costs that
support the 4G LTE network. The increase in cost of services was also
impacted by higher roaming costs incurred in markets divested during
2010 and increased data roaming. Partially offsetting these increases was
a decrease in costs for long distance and data services and applications.
Cost of services and sales decreased during 2010 compared to 2009
due to a decrease in the cost of equipment sales, partially offset by an
increase in cost of services. Cost of equipment sales decreased by $0.6
billion primarily due to both a decrease in retail customer gross addi-
tions and cost reduction initiatives, partially offset by an increase in the
average cost per unit. Cost of services increased due to higher wireless
network costs driven by increases in local interconnection cost as a result
of both higher capacity needs from increases in data usage as well as
costs incurred to transition to Ethernet facilities used to support the 4G
LTE network. In addition, the increase in costs of services was impacted by
higher roaming costs as a result of increased international roaming vol-
umes, data roaming and roaming costs incurred in the markets divested
during 2010, partially offset by synergies from moving traffic to our own
network. Also contributing to higher wireless network costs during 2010
compared to 2009 was an increase in operating lease expense related to
our network cell sites.
Selling, General and Administrative Expense
Selling, general and administrative expense increased during 2011 com-
pared to 2010 primarily due to higher sales commission expense in our
indirect channel. Indirect sales commission expense increased $1.2 bil-
lion during 2011 compared to 2010 as a result of increases in the average
commission per unit, as the mix of units continues to shift toward data
devices and more customers activate data services, and increased con-
tract renewals in connection with equipment upgrades.
Selling, general and administrative expense increased during 2010
compared to 2009 primarily due to an increase in sales commission
expense in our indirect channel, as well as increases in other general and
administrative expenses, partially offset by a decrease in advertising and
promotional costs. Indirect sales commission expense increased $0.8
billion during 2010 compared to 2009 as a result of increases in both
the average commission per unit, as the mix of units continues to shift
toward data devices and more customers activate data service, and in
contract renewals in connection with equipment upgrades. Other gen-
eral and administrative expenses such as billing and data processing
charges, non-income taxes, and bad debt expense increased primarily as
a result of the growth of our customer base. Advertising and promotional
costs decreased $0.2 billion during 2010 compared to 2009 primarily due
to reductions in media spending.
Depreciation and Amortization Expense
The changes in depreciation and amortization expense during 2011 and
2010 compared to the preceding year were primarily driven by growth in
depreciable assets.
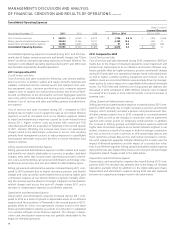
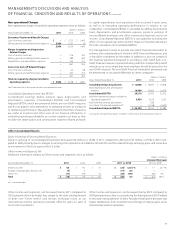
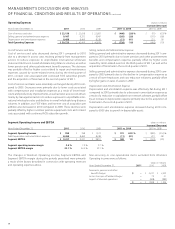
Operating Expenses (dollars in millions)
Increase/(Decrease)
Years Ended December 31, 2011 2010 2009 2011 vs. 2010 2010 vs. 2009
Cost of services and sales $ 24,086 $ 19,245 $ 19,348 $ 4,841 25.2 % $ (103) (0.5)%
Selling, general and administrative expense 19,579 18,082 17,309 1,497 8.3 773 4.5
Depreciation and amortization expense 7,962 7,356 7,030 606 8.2 326 4.6
Total Operating Expenses $ 51,627 $ 44,683 $ 43,687 $ 6,944 15.5 $ 996 2.3
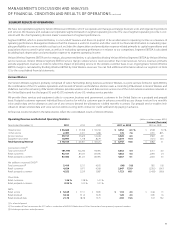
Segment Operating Income and EBITDA (dollars in millions)
Increase/(Decrease)
Years Ended December 31, 2011 2010 2009 2011 vs. 2010 2010 vs. 2009
Segment Operating Income $ 18,527 $ 18,724 $ 16,638 $ (197) (1.1)% $ 2,086 12.5 %
Add Depreciation and amortization expense 7,962 7,356 7,030 606 8.2 326 4.6
Segment EBITDA $ 26,489 $ 26,080 $ 23,668 $ 409 1.6 $ 2,412 10.2
Segment operating income margin 26.4 % 29.5 % 27.6 %
Segment EBITDA service margin 44.8 % 46.9 % 45.5 %
The changes in the table above during the periods presented were pri-
marily a result of the factors described in connection with operating
revenues and operating expenses above.
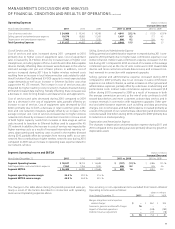
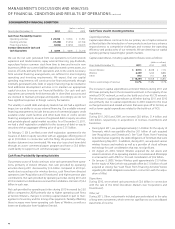
Non-recurringornon-operationalitemsexcludedfromVerizonWireless’
Operating income were as follows:
(dollars in millions)
Years Ended December 31, 2011 2010 2009
Mergerintegrationandacquisition
related charges $ – $ 867 $ 954
Severance, pension and benefit charges 76 – –
Impact of divested operations – (348) (789)
Deferred revenue adjustment – 235 (78)
$ 76 $ 754 $ 87