Verizon Wireless 2011 Annual Report Download - page 69
Download and view the complete annual report
Please find page 69 of the 2011 Verizon Wireless annual report below. You can navigate through the pages in the report by either clicking on the pages listed below, or by using the keyword search tool below to find specific information within the annual report.-
 1
1 -
2
-
3
-
4
-
5
-
6
-
7
-
8
-
9
-
10
-
11
-
12
-
13
-
14
-
15
-
16
-
17
-
18
-
19
-
20
-
21
-
22
-
23
-
24
-
25
-
26
-
27
-
28
-
29
-
30
-
31
-
32
-
33
-
34
-
35
-
36
-
37
-
38
-
39
-
40
-
41
-
42
-
43
-
44
-
45
-
46
-
47
-
48
-
49
-
50
-
51
-
52
-
53
-
54
-
55
-
56
-
57
-
58
-
 59
59 -
 60
60 -
 61
61 -
 62
62 -
 63
63 -
 64
64 -
 65
65 -
 66
66 -
 67
67 -
 68
68 -
 69
69 -
 70
70 -
 71
71 -
 72
72 -
 73
73 -
 74
74 -
 75
75 -
 76
76 -
 77
77 -
 78
78 -
 79
79 -
80
-
81
-
82
-
83
-
84
-
85
-
86
-
87
-
88
 |
 |

nOtEs tO cOnsOlidatEd Financial statEMEnts continued
67
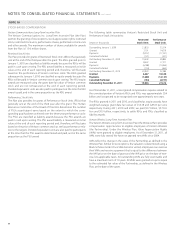
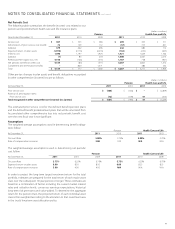
NOTE 9
FAIR VALUE MEASUREMENTS AND FINANCIAL INSTRUMENTS
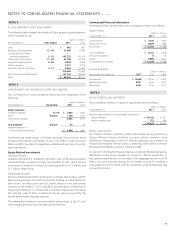
The following table presents the balances of assets measured at fair value
on a recurring basis as of December 31, 2011:
(dollars in millions)
Level 1(1) Level 2(2) Level 3(3) Total
Assets:
Short-term investments:
Equity securities $ 259 $ – $ – $ 259
Fixed income securities 2 331 – 333
Other Current Assets:
Forward contracts – 1 – 1
Other Assets:
Fixed income securities 220 763 – 983
Interest rate swaps – 625 – 625
Cross currency swaps – 77 – 77
Total $ 481 $ 1,797 $ – $ 2,278
(1) quoted prices in active markets for identical assets or liabilities
(2) observable inputs other than quoted prices in active markets for identical
assets and liabilities
(3) no observable pricing inputs in the market
Equity securities consist of investments in common stock of domestic and
international corporations measured using quoted prices in active markets.
Fixed income securities consist primarily of investments in U.S. Treasuries
and agencies, as well as municipal bonds. We use quoted prices in active
markets for our U.S. Treasury securities, and therefore these securities are
classified as Level 1. For all other fixed income securities that do not have
quoted prices in active markets, we use alternative matrix pricing as a prac-
tical expedient resulting in these debt securities being classified as Level 2.
Derivative contracts are valued using models based on readily observable
market parameters for all substantial terms of our derivative contracts
and thus are classified within Level 2. We use mid-market pricing for fair
value measurements of our derivative instruments.
We recognize transfers between levels of the fair value hierarchy as of the
end of the reporting period. There were no transfers within the fair value
hierarchy during 2011.
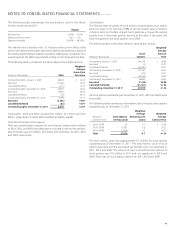
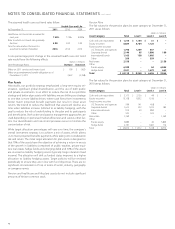
Fair Value of Short-term and Long-term Debt
The fair value of our short-term and long-term debt, excluding capital
leases, which is determined based on market quotes for similar terms and
maturities or future cash flows discounted at current rates, was as follows:
(dollars in millions)
At December 31, 2011 2010
Carrying
Amount Fair Value
Carrying
Amount Fair Value
Short- and long-term debt,
excluding capital leases $ 54,800 $ 64,485 $ 52,462 $ 59,020
Derivatives
Interest Rate Swaps
We have entered into domestic interest rate swaps to achieve a targeted
mix of fixed and variable rate debt. We principally receive fixed rates and
pay variable rates based on LIBOR, resulting in a net increase or decrease
to Interest expense. These swaps are designated as fair value hedges and
hedge against changes in the fair value of our debt portfolio. We record
the interest rate swaps at fair value on our consolidated balance sheets
as assets and liabilities. Changes in the fair value of the interest rate
swaps due to changes in interest rates are recorded to Interest expense,
which are offset by changes in the fair value of the debt. The fair value of
these contracts was $0.6 billion at December 31, 2011 and $0.3 billion at
December 31, 2010 and is primarily included in Other assets and Long-
term debt. As of December 31, 2011, the total notional amount of these
interest rate swaps was $7.0 billion.
Forward Interest Rate Swaps
In order to manage our exposure to future interest rate changes, during
2010, we entered into forward interest rate swaps with a total notional
value of $1.4 billion. We designated these contracts as cash flow hedges.
The fair value of these contracts was $0.1 billion at December 31, 2010
and the contracts were included in Other assets. In 2011, we terminated
these forward interest rate swaps.
Cross Currency Swaps
During 2008, Verizon Wireless entered into cross currency swaps des-
ignated as cash flow hedges to exchange approximately $2.4 billion of
British Pound Sterling and Euro-denominated debt into U.S. dollars and
to fix our future interest and principal payments in U.S. dollars, as well
as mitigate the impact of foreign currency transaction gains or losses.
During December 2011, we repaid $0.9 billion upon maturity for the €0.7
billion of 7.625% Verizon Wireless Notes. The settlement of the related
cross currency swap did not have a material impact on our financial
statements. The fair value of the outstanding swaps, primarily included
in Other assets, was approximately $0.1 billion at December 31, 2011 and
December 31, 2010, respectively. During 2011, the pretax loss recognized
in Other comprehensive income was not significant. During 2010, a pre-
tax loss of $0.2 billion was recognized in Other comprehensive income.
A portion of these gains and losses recognized in Other comprehensive
income was reclassified to Other income and (expense), net to offset the
related pretax foreign currency transaction gain or loss on the underlying
debt obligations.
Prepaid Forward Agreement
During the first quarter of 2009, we entered into a privately negotiated
prepaid forward agreement for 14 million shares of Verizon common
stock at a cost of approximately $0.4 billion. We terminated the prepaid
forward agreement with respect to 5 million of the shares during the
fourth quarter of 2009 and 9 million of the shares during the first quarter
of 2010, which resulted in the delivery of those shares to Verizon.
Concentrations of Credit Risk
Financial instruments that subject us to concentrations of credit risk con-
sist primarily of temporary cash investments, short-term and long-term
investments, trade receivables, certain notes receivable, including lease
receivables, and derivative contracts. Our policy is to deposit our tem-
porary cash investments with major financial institutions. Counterparties
to our derivative contracts are also major financial institutions. The finan-
cial institutions have all been accorded high ratings by primary rating
agencies. We limit the dollar amount of contracts entered into with any
one financial institution and monitor our counterparties’ credit ratings.
We generally do not give or receive collateral on swap agreements due
to our credit rating and those of our counterparties. While we may be
exposed to credit losses due to the nonperformance of our counterpar-
ties, we consider the risk remote and do not expect the settlement of
these transactions to have a material effect on our results of operations
or financial condition.